Every month we pull together tools, research, and ideas for journalists wearing… many hats.
This column started as a newsletter on iMEdD’s LinkedIn.
You can subscribe and find all past issues here.
Media Hat: July’s fine print

Every month we pull together tools, research, and ideas for journalists wearing… many hats.
August is slow, so we’re keeping this one light and visual: a few useful tools, things to look at, and links worth saving for later. No need to explore them from your vacation, they’ll still be here when you’re back!
If this is the first time you came across this newsletter and you’re one of the many people who are new here, welcome!
Each month, we round up tools, ideas, and behind-the-scenes insights to help journalists who wear many “hats”: reporters, editors, producers, creators, and everything in between.
Up your sleeve
Tools and tricks you can put to work right away
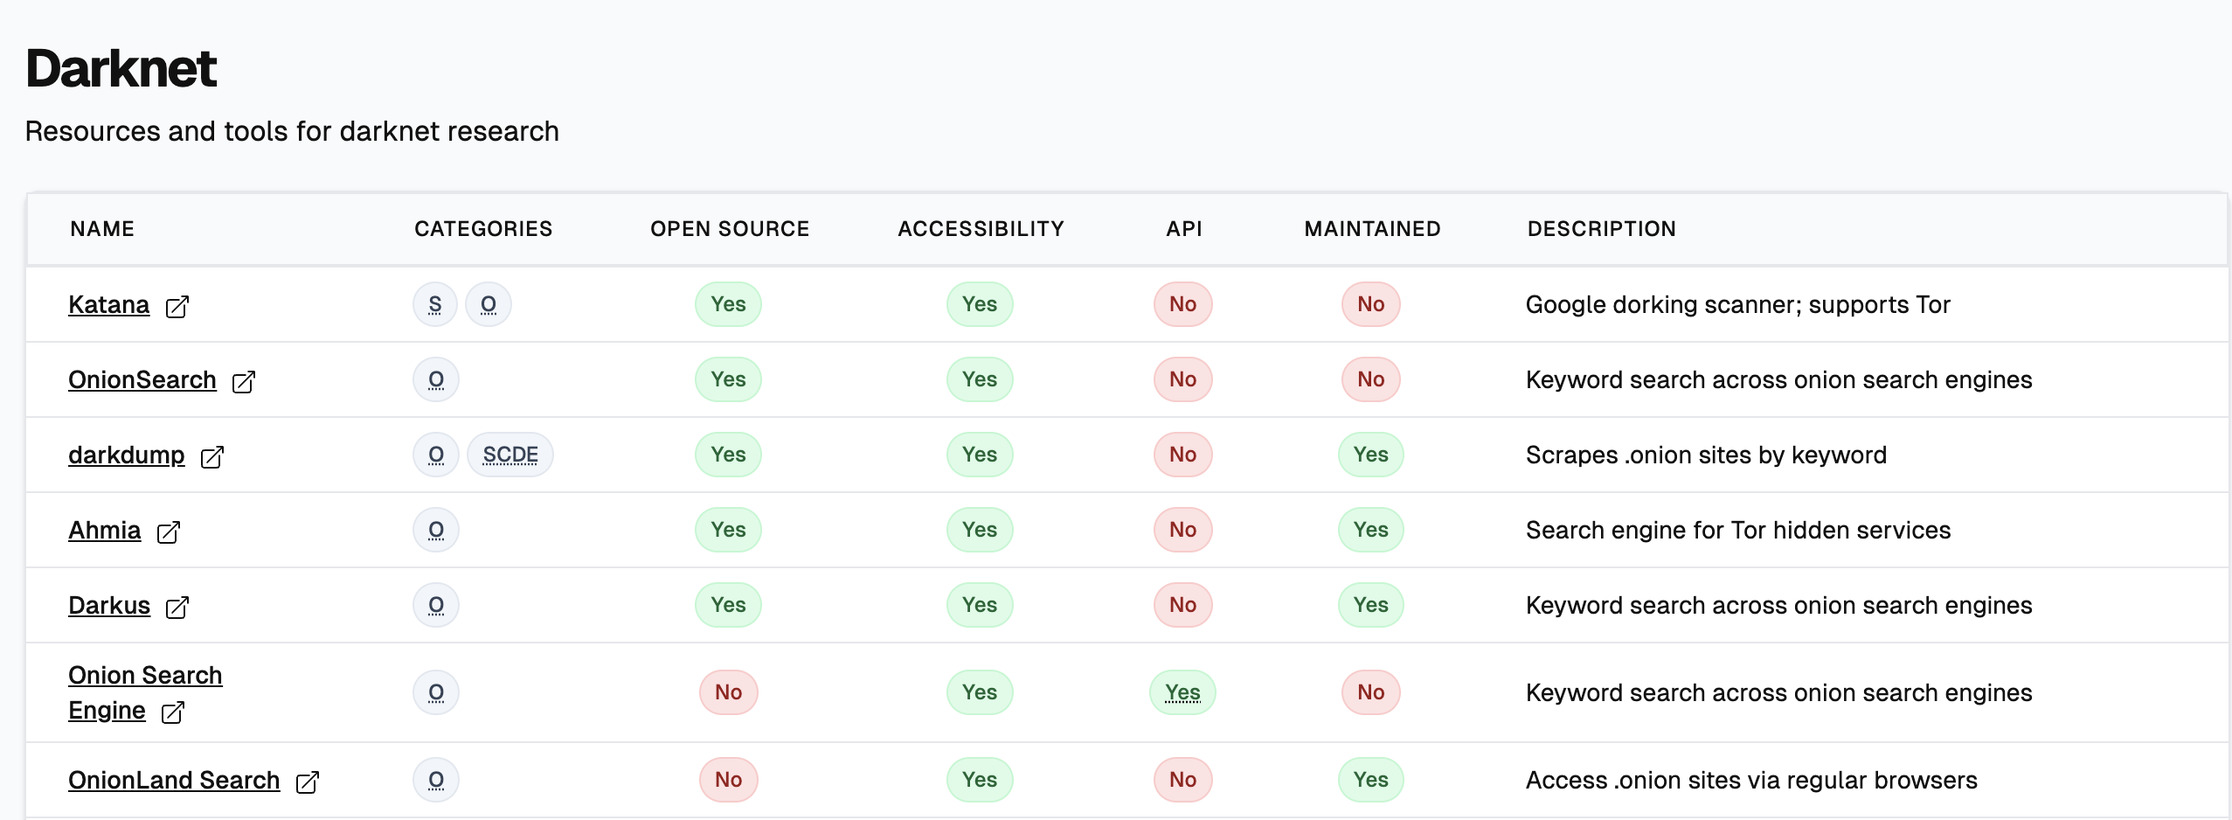
150+ OSINT tools, compared
Not sure which OSINT tool to use? Researchers analyzed more than 150 tools, services, and databases and put the findings into OSINT Hub. You can compare what each tool does, how accessible it is, and more. The full dataset is also open on GitHub and already getting community updates.
Tip: Pick something you’ve investigated recently and see if OSINT Hub suggests a tool you haven’t used before.
👉 Explore it
📌 Good for: investigative reporters, fact-checkers, OSINT researchers, data journalists
Put your leadership skills under pressure
The Crisis Leadership Simulation by The Fix Media puts you in charge of a fictional media outlet or NGO, with decisions to make about people, budgets, and priorities as challenges unfold. Tested with 300+ participants, it’s a practical way to see how you (and your team) make decisions under pressure.
👉 Explore the simulation
📌 Good for: journalism educators, newsroom managers, journalism students
How decentralized is the internet, really?
Are We Decentralized Yet? is a live tracker showing how concentrated accounts and user data are across Bluesky, the Fediverse, email, web hosting, and other internet infrastructure.
👉 Try it out
📌 Good for: tech reporters, data journalists
Behind the scenes
Research, explainers & deeper context to help you connect the dots
Watching the weather move
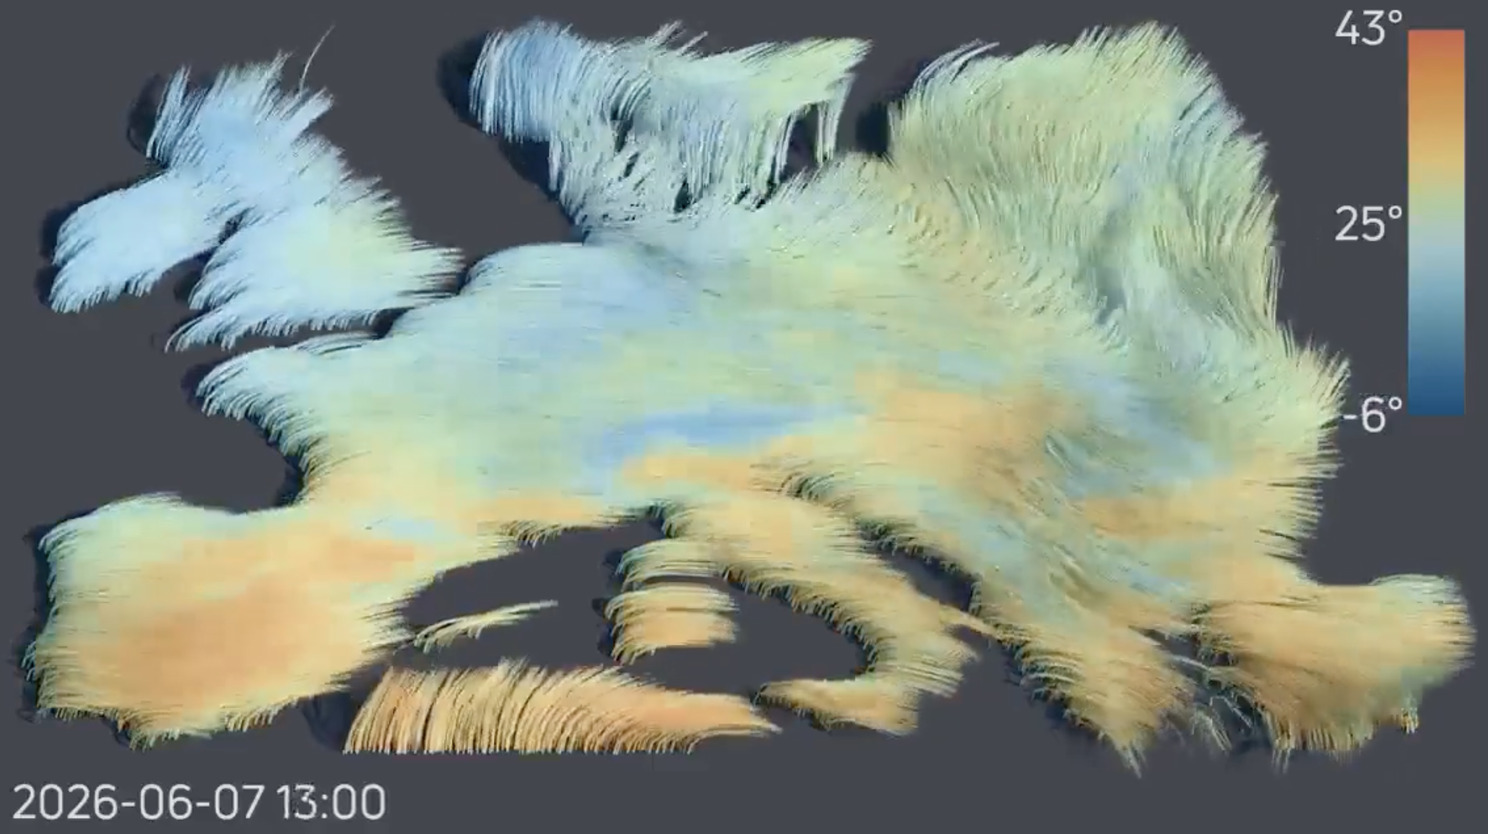
Researcher Jeran Poehls turned ERA5 weather data from June into a striking visualization of wind patterns and air temperature across Europe. By stripping away labels and basemap clutter, the result makes atmospheric patterns surprisingly easy and satisfying to watch.
👉 Watch the workflow
A case study library for audience teams
Looking for examples of what other publishers are trying? Audiencers s has put all of its case studies into one searchable database. You can filter by newsletters, paywalls, pricing, onboarding, AI, young readers, and more, with examples from publishers around the world. 👉 Check it out
Community Spotlight
New voices, bold experiments, and big ideas from the field
A secure workspace for cross-border teams
Arena for Journalism in Europe‘s Collaborative Desk gives cross-border teams a secure, customised workspace built with open-source tools. They also help with digital security and coordination, so teams can spend less time managing the setup and more time on the journalism.
👉 Explore it
A grant for cross-border investigations
Journalismfund Europe’s Invisible Life Grant Programme supports cross-border investigations into farm animal welfare, from living conditions to supply chains and public health. Teams need a clear hypothesis, methodology, budget, and plans to publish in at least two countries.
👉 Apply by 27 August
Let’s chat!
Found something useful here? Or something we should know about? We’d love to hear from you. And if you know someone who might find Media Hat useful, feel free to send it their way.
See you next month!