
We publish data on the geographical distribution of 3,214 deaths per regional unit. Data analysis indicates Northern Greece is paying a heavy price during the pandemic.
Open data on coronavirus in Greece
We gathered published data on the course of the infectious disease in our country from every available source and structured open datasets, which are freely available to journalists and researchers.
More than 3,600 people have lost their lives to COVID-19 in Greece since the onset of the pandemic, of which 3,061 passed between November 1st to December 14th.
Unlike elsewhere in Europe, the National Public Health Organization (EODY) has been providing data on the geographical distribution of new cases in Greece, however, the organization does not publish more detailed data on the pandemic death toll.
From the onset of the pandemic until mid-November, iMEdD Lab has been systematically updating data on COVID-19 related deaths per regional unit, using press releases as its main source. The dataset was visualized using the specialized application we developed for COVID-19, while it has also been published on our GitHub account. As of early November, however, no information on deceased persons’ locations has been disclosed.
How the application monitoring the spread of the disease was created
Work stages, sources/processing of data, tools and limitations regarding the development of iMEdD Lab’s web application tracking the pandemic in Greece and around the world.
A deluge of death in Northern Greece
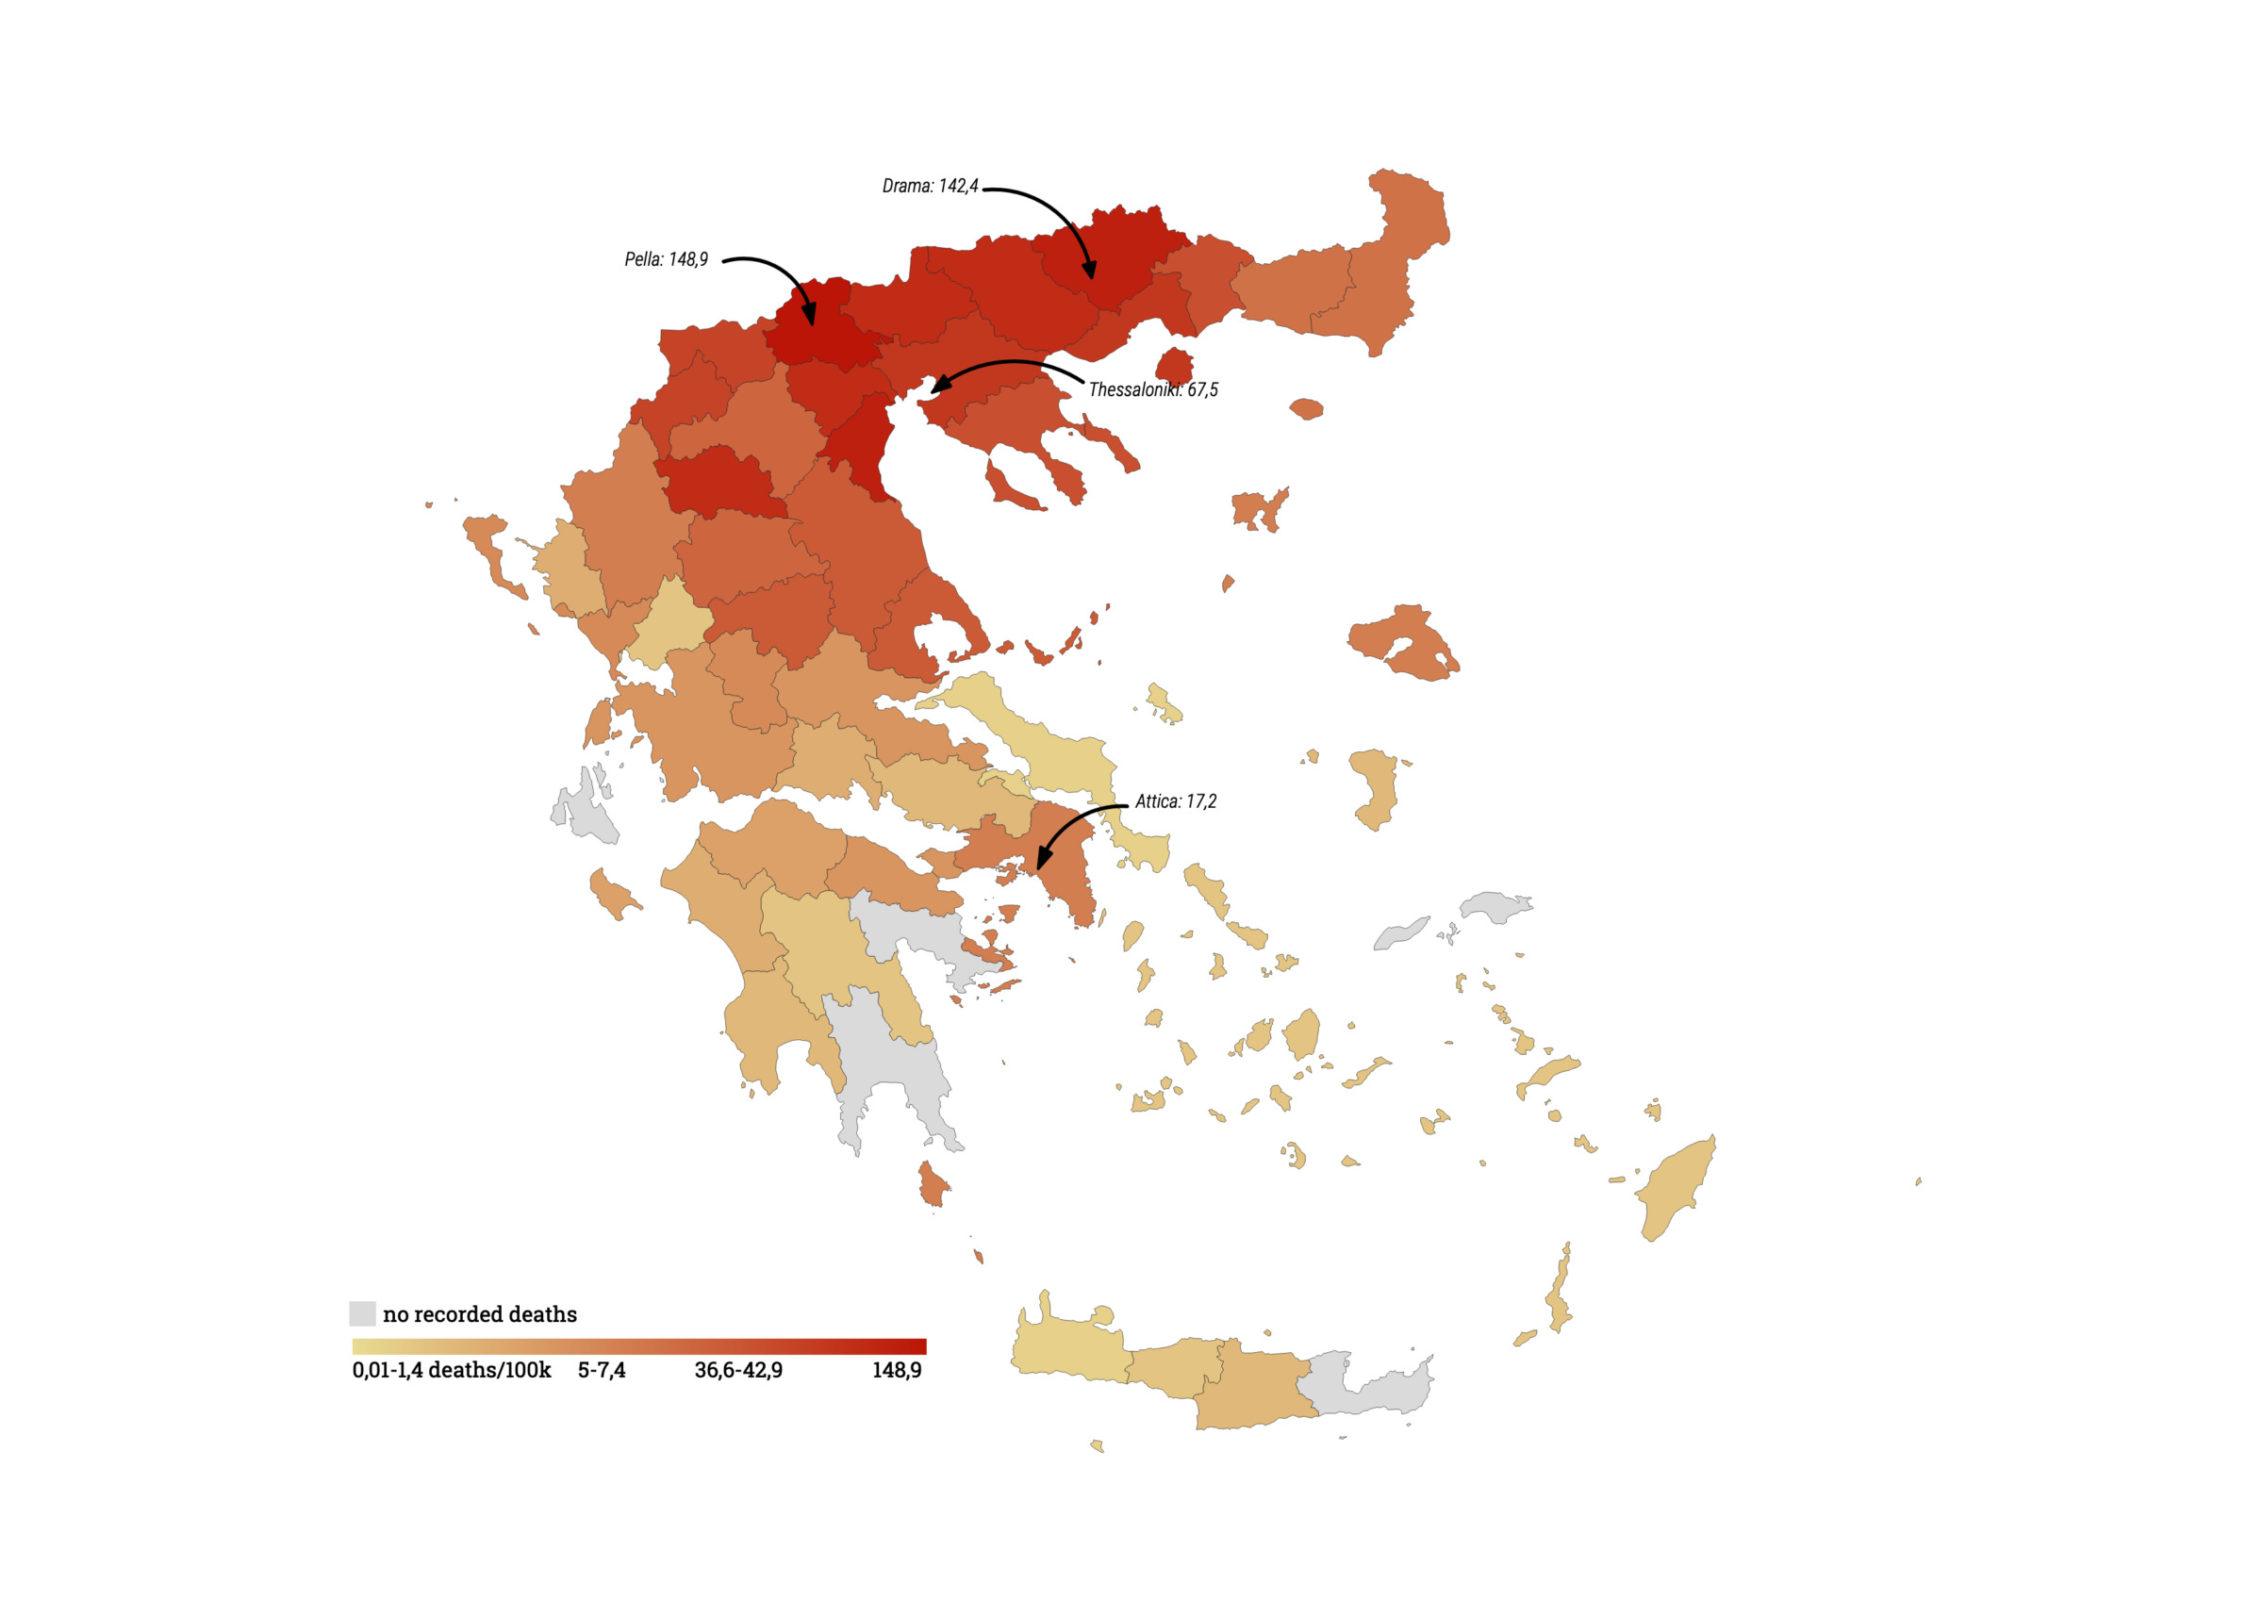
iMEdD Lab was able to collect anonymous data on the geographical distribution of 3,214 deaths that have occurred since the onset of the pandemic (corresponding to 87% of a total of 3,687 deaths as of December 14) per regional unit. Data analysis suggests that the worst-hit areas are Thessaloniki (750 deaths) and Attica (659 deaths), followed by Pella (208 deaths), Serres (184 deaths), Pieria (148 deaths), Imathia (138 deaths), Drama (140 deaths) and Larissa (122 deaths).
However, after estimating the number of deaths per 100,000 population (which allows us to make comparisons across different areas), the most affected areas were found to be: Pella (148.9 deaths per 100,000 people), Drama (142.4 ), Pieria (116.8) and Serres (104.3). Thessaloniki has 67.5 deaths per 100,000 population and Attica 17.2.
| Περιφέρεια | Περφερειακή Ενότητα | Θάνατοι | Θάνατοι/100k | Θνητότητα (%) |
|---|---|---|---|---|
| Περιφέρεια Κεντρικής Μακεδονίας | Π.Ε. Πέλλας | 208 | 148.9 | 5.3 |
| Περιφέρεια Ανατολικής Μακεδονίας Θράκης | Π.Ε. Δράμας | 140 | 142.4 | 5.1 |
| Περιφέρεια Κεντρικής Μακεδονίας | Π.Ε. Πιερίας | 148 | 116.8 | 5.3 |
| Περιφέρεια Κεντρικής Μακεδονίας | Π.Ε. Σερρών | 184 | 104.3 | 5.6 |
| Περιφέρεια Κεντρικής Μακεδονίας | Π.Ε. Κιλκίς | 79 | 98.2 | 4.8 |
| Περιφέρεια Κεντρικής Μακεδονίας | Π.Ε. Ημαθίας | 138 | 98.1 | 5.2 |
| Περιφέρεια Δυτικής Μακεδονίας | Π.Ε. Γρεβενών | 31 | 97.6 | 5.1 |
| Περιφέρεια Ανατολικής Μακεδονίας Θράκης | Ν. Καβάλας | 96 | 69.2 | 5.0 |
| Περιφέρεια Κεντρικής Μακεδονίας | Π.Ε. Θεσσαλονίκης | 750 | 67.5 | 2.8 |
| Περιφέρεια Δυτικής Μακεδονίας | Π.Ε. Φλώρινας | 31 | 60.3 | 3.2 |
| Περιφέρεια Δυτικής Μακεδονίας | Π.Ε. Καστοριάς | 30 | 59.6 | 4.0 |
| Περιφέρεια Κεντρικής Μακεδονίας | Π.Ε. Χαλκιδικής | 60 | 55.7 | 3.5 |
| Περιφέρεια Ανατολικής Μακεδονίας Θράκης | Π.Ε. Ξάνθης | 60 | 53.9 | 3.0 |
| Περιφέρεια Θεσσαλίας | Π.Ε. Λαρίσης | 122 | 42.9 | 2.3 |
| Περιφέρεια Θεσσαλίας | Ν. Μαγνησίας | 80 | 39.3 | 3.4 |
| Περιφέρεια Θεσσαλίας | Π.Ε. Καρδίτσας | 44 | 38.8 | 2.8 |
| Περιφέρεια Θεσσαλίας | Π.Ε. Τρικάλων | 48 | 36.6 | 3.4 |
| Περιφέρεια Δυτικής Μακεδονίας | Π.Ε. Κοζάνης | 52 | 34.6 | 2.7 |
| Περιφέρεια Ανατολικής Μακεδονίας Θράκης | Π.Ε. Έβρου | 34 | 23.0 | 1.9 |
| Περιφέρεια Ανατολικής Μακεδονίας Θράκης | Π.Ε. Ροδόπης | 25 | 22.3 | 1.5 |
| Περιφέρεια Ηπείρου | Π.Ε. Ιωαννίνων | 31 | 18.5 | 2.2 |
| Περιφέρεια Βορείου Αιγαίου | Ν. Λέσβου | 19 | 18.3 | 1.2 |
| Περιφέρεια Αττικής | Περιφέρεια Αττικής | 659 | 17.2 | 2.0 |
| Περιφέρεια Ηπείρου | Π.Ε. Πρεβέζης | 9 | 15.7 | 4.9 |
| Περιφέρεια Στερεάς Ελλάδας και Εύβοιας | Π.Ε. Ευρυτανίας | 2 | 10.0 | 0.9 |
| Περιφέρεια Ιονίων Νήσων | Π.Ε. Κέρκυρας | 10 | 9.6 | 2.2 |
| Περιφέρεια Δυτικής Ελλάδας | Π.Ε. Αιτωλοακαρνανίας | 19 | 9.0 | 2.3 |
| Περιφέρεια Στερεάς Ελλάδας και Εύβοιας | Π.Ε. Φθιώτιδος | 14 | 8.8 | 2.2 |
| Περιφέρεια Ιονίων Νήσων | Π.Ε. Λευκάδας | 2 | 8.4 | 4.3 |
| Περιφέρεια Πελοποννήσου | Π.Ε. Κορινθίας | 12 | 8.3 | 2.2 |
| Περιφέρεια Ιονίων Νήσων | Π.Ε. Ζακύνθου | 3 | 7.4 | 3.8 |
| Περιφέρεια Δυτικής Ελλάδας | Π.Ε. Αχαϊας | 18 | 5.8 | 1.4 |
| Περιφέρεια Δυτικής Ελλάδας | Π.Ε. Ηλείας | 8 | 5.0 | 2.0 |
| Περιφέρεια Στερεάς Ελλάδας και Εύβοιας | Π.Ε. Φωκίδας | 2 | 5.0 | 1.1 |
| Περιφέρεια Ηπείρου | Π.Ε. Θεσπρωτίας | 2 | 4.6 | 1.5 |
| Περιφέρεια Στερεάς Ελλάδας και Εύβοιας | Π.Ε. Βοιωτίας | 5 | 4.2 | 0.8 |
| Περιφέρεια Βορείου Αιγαίου | Ν. Χίου | 2 | 3.8 | 0.7 |
| Περιφέρεια Πελοποννήσου | Π.Ε. Μεσσηνίας | 6 | 3.8 | 1.0 |
| Περιφέρεια Κρήτης | Π.Ε. Ηρακλείου | 11 | 3.6 | 1.0 |
| Περιφέρεια Ηπείρου | Π.Ε. Άρτας | 2 | 2.9 | 0.9 |
| Περιφέρεια Νοτίου Αιγαίου | Ν. Δωδεκανήσου | 5 | 2.6 | 1.0 |
| Περιφέρεια Νοτίου Αιγαίου | Ν. Κυκλάδων | 3 | 2.5 | 0.6 |
| Περιφέρεια Κρήτης | Π.Ε. Ρεθύμνης | 2 | 2.3 | 0.9 |
| Περιφέρεια Πελοποννήσου | Π.Ε. Αρκαδίας | 2 | 2.3 | 0.7 |
| Περιφέρεια Κρήτης | Π.Ε. Χανίων | 3 | 1.9 | 0.5 |
| Περιφέρεια Στερεάς Ελλάδας και Εύβοιας | Π.Ε. Ευβοίας | 3 | 1.4 | 0.7 |
| Άγιον Όρος | Άγιο Όρος | 0 | 0.0 | 0.0 |
| Περιφέρεια Πελοποννήσου | Π.Ε. Αργολίδας | 0 | 0.0 | 0.0 |
| Περιφέρεια Ιονίων Νήσων | Ν. Κεφαλληνίας | 0 | 0.0 | 0.0 |
| Περιφέρεια Πελοποννήσου | Π.Ε. Λακωνίας | 0 | 0.0 | 0.0 |
| Περιφέρεια Κρήτης | Π.Ε. Λασιθίου | 0 | 0.0 | 0.0 |
| Περιφέρεια Βορείου Αιγαίου | Ν. Σάμου | 0 | 0.0 | 0.0 |
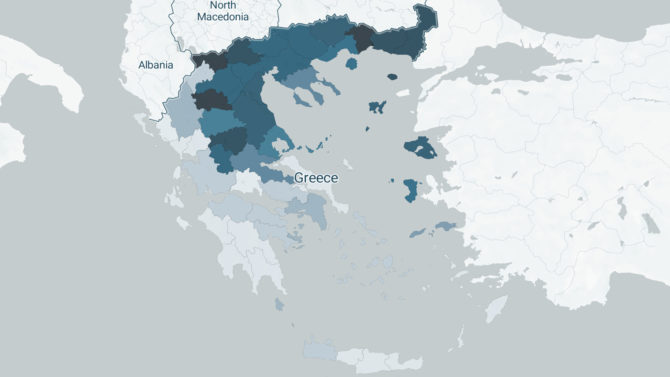
In addition to deaths per 100,000 population, the following map also shows mortality from COVID-19 (deaths per confirmed case).
The geographical distribution of COVID-19 related deaths
The case fatality rate indicates the proportion of people who die who have tested positive for the disease and even though it is very crucial, it should be interpreted with caution. This is due to the fact that the number of people diagnosed with COVID-19 does not correspond to the actual population that has contracted the virus. This happens because, on the one hand, the entire population has not been tested and, on the other, because those who are being tested are usually individuals who have already showed some symptoms. For these reasons, the case fatality rate may be overestimated compared to the actual risk of death from COVID-19.
Deaths ratio in population

