
A new statistical analysis tool for journalists who are not familiar with statistics, machine learning or programming languages.
The “A + Ω” platform is a data analysis tool that offers users ready-to-use analysis “recipes” (algorithms) helping them to make predictions, correlations, and detect fraud in election data and other analyses without any need for background knowledge in statistics, machine learning or programming languages. The platform was selected by Google and funded through Google’s Digital News Initiative (DNI).
All journalists need to do is upload an Excel or CSV file and proceed to select an analysis method. Results will subsequently be returned from the algorithm based on the file uploaded by the user.
For every recipe, information is provided on the way each method of analysis works (“How it works”) and the most common issues users may face upon editing files they uploaded.
The use of each recipe does not require any scientific knowledge or methodology, but attention to the type of file used is required.
Here is an example with instructions for the recipe detecting electoral fraud.
Users who have already conducted their own analysis on a particular issue and wish to recommend their work to other users or professionals who are looking for a solution to similar problems but lack the necessary scientific knowledge to do so, can also upload recipes to the platform.

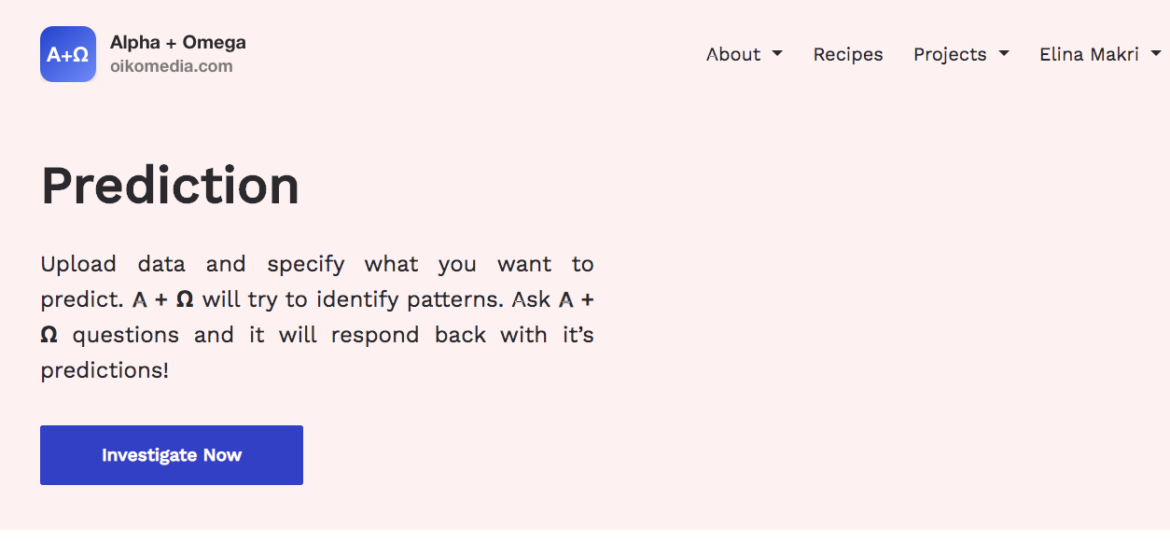
Example of the forecasting recipe
Let us assume we want to predict a country’s Gross National Income (GNI) in dollars. What kind of data do we need for the algorithm to work properly (i.e. to identify patterns) and make a prediction?
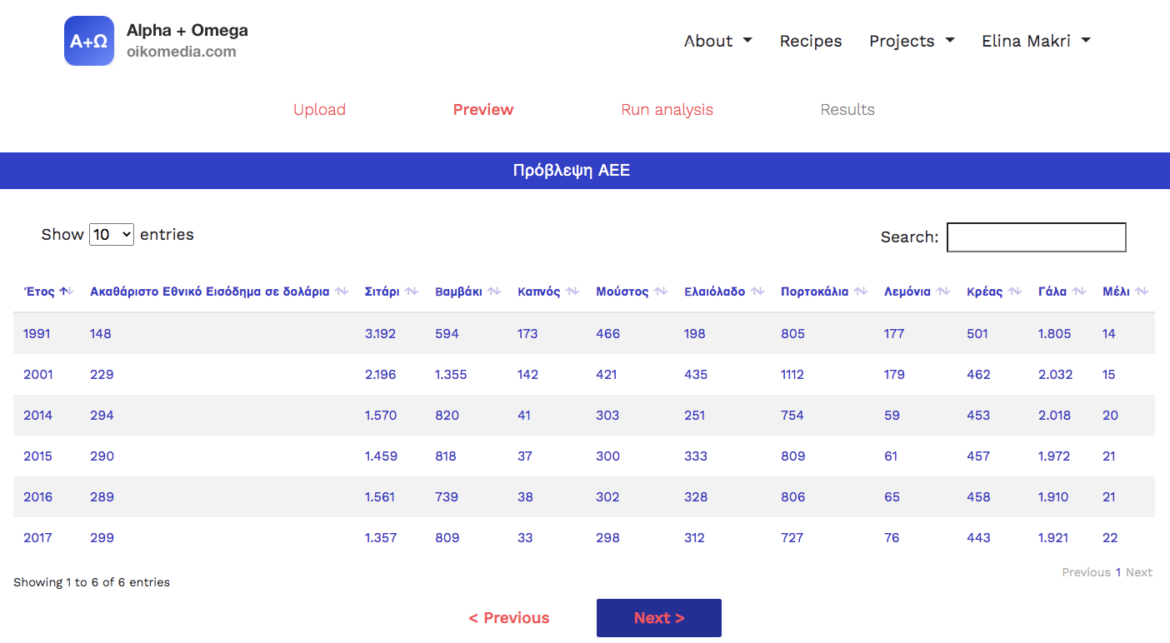
In the CSV (or Excel) file we created, we selected certain agricultural products to help us predict a country’s GNI. We considered that the production of goods is related to GNI and we attempted to build a model based on that. We did not know in advance whether a particular product would be directly related to GNI and whether it would play a greater role in forecasting.
Steps:
1. Go to the Alpha + Omega (A+Ω) page and select the forecasting recipe (after registering on the platform).
2. Create a project.
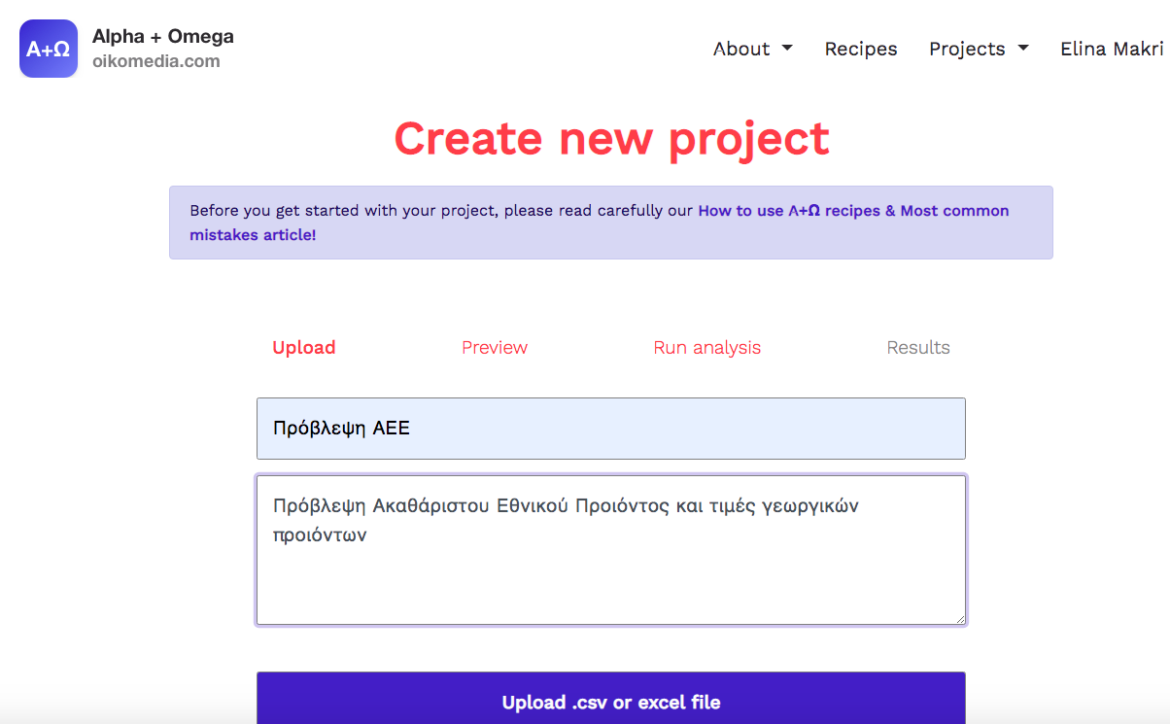
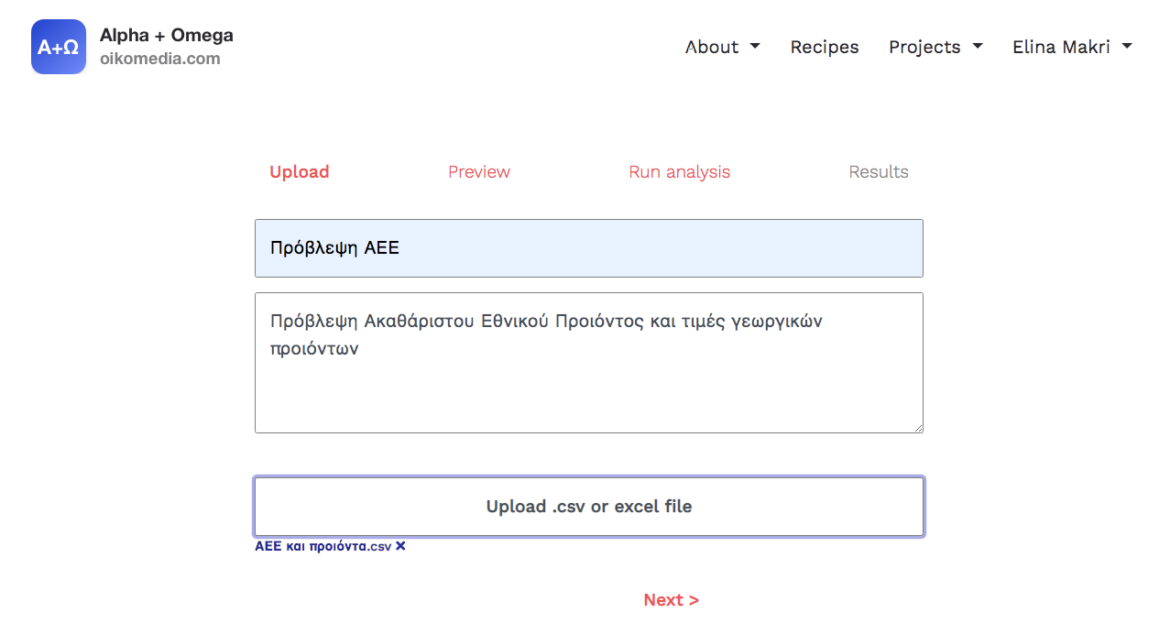
3. Upload the CSV/Excel file.
Workbench: Data analysis platform in Greek

The workbench platform was launched by Columbia University, New York. With the support of iMEdD and in collaboration with the Laboratory of New Technologies of the National and Kapodistrian University of Athens, the platform has now been introduced to Greece.
4. See all file data on A+Ω.
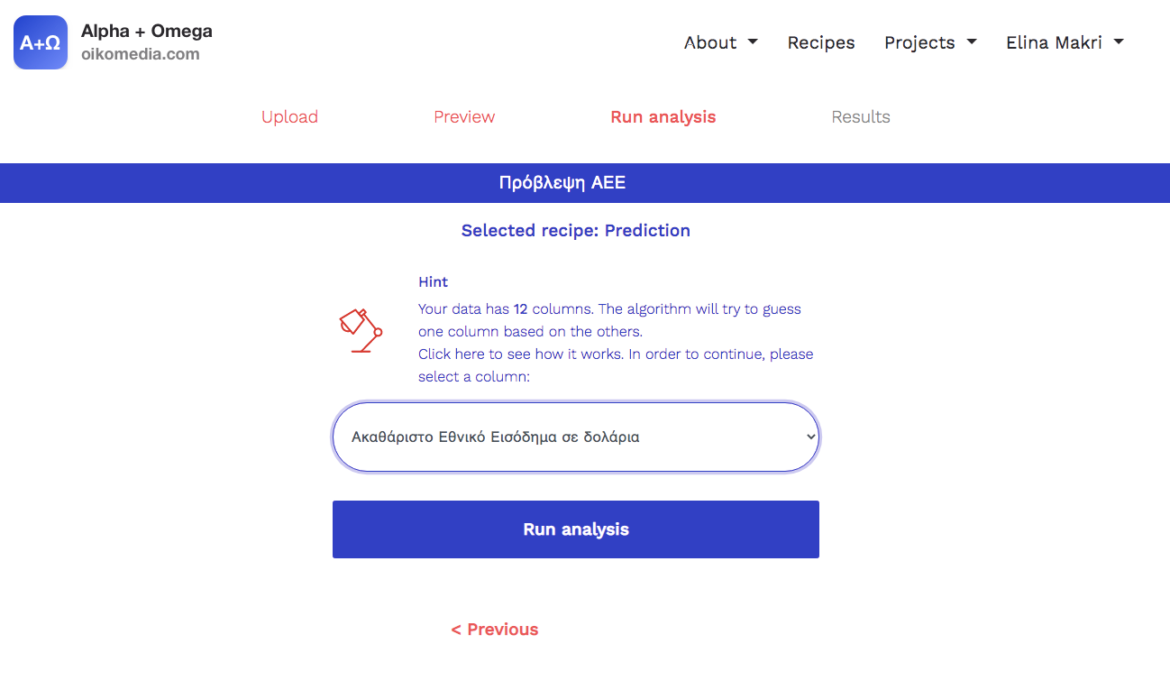
5. Click next and select the column for which you want to make a prediction. Let’s suppose you want to predict the GNI for the year 2022. Your file does not contain data on 2022.
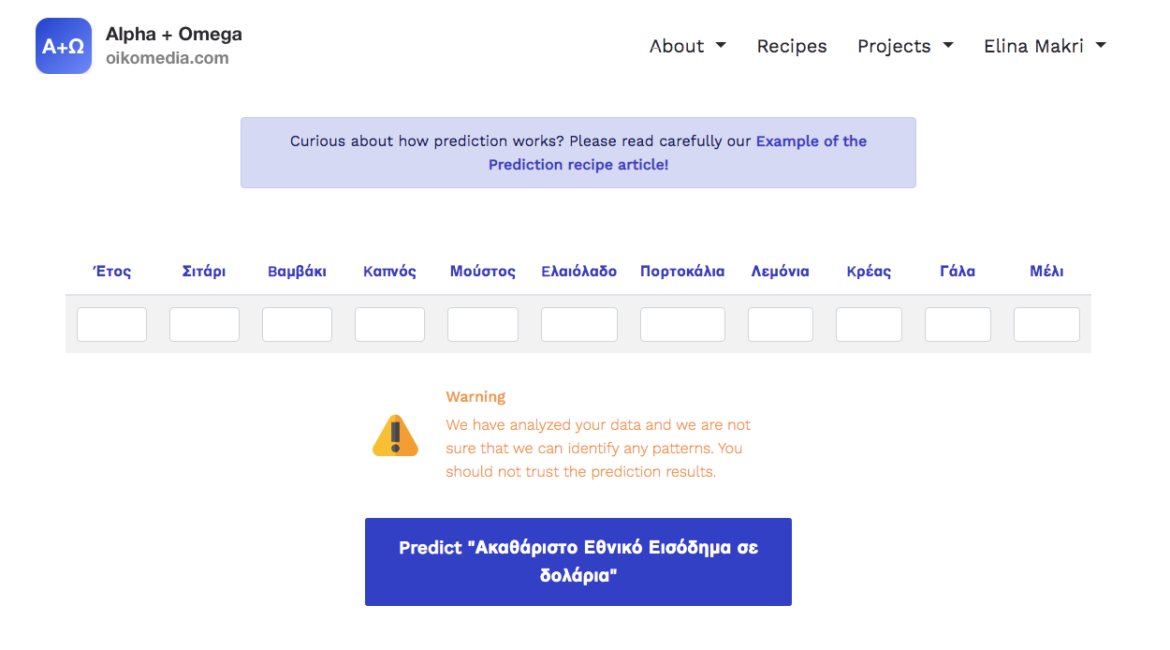
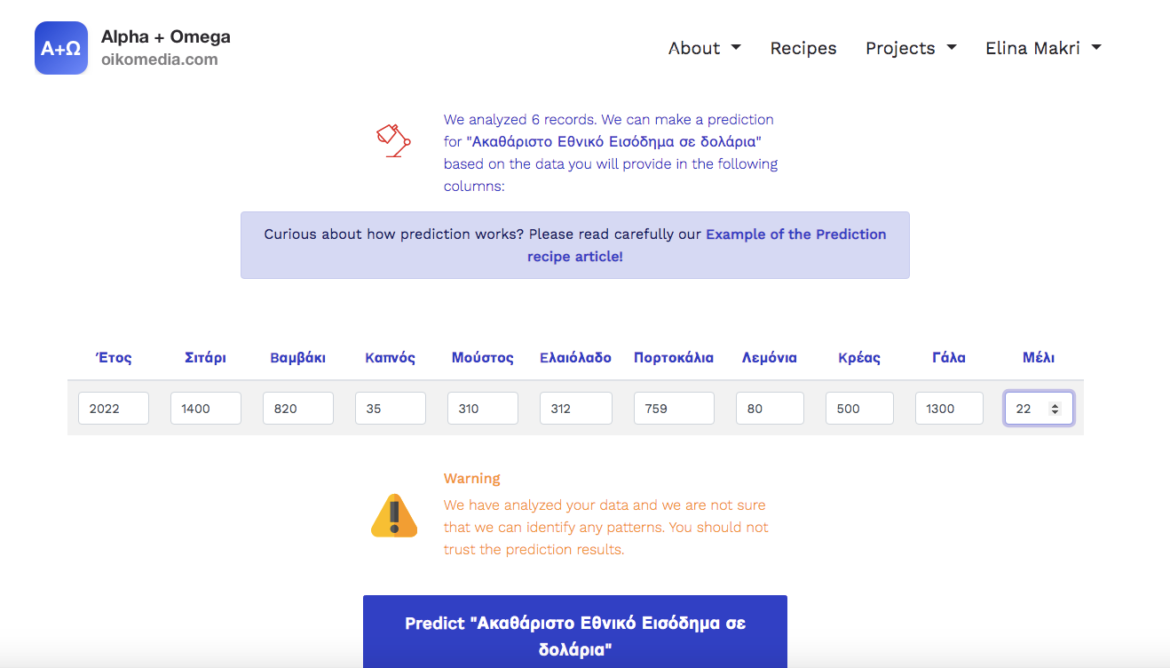
6. Insert hypothetical estimates for data in the remaining columns of the file for the year 2022.
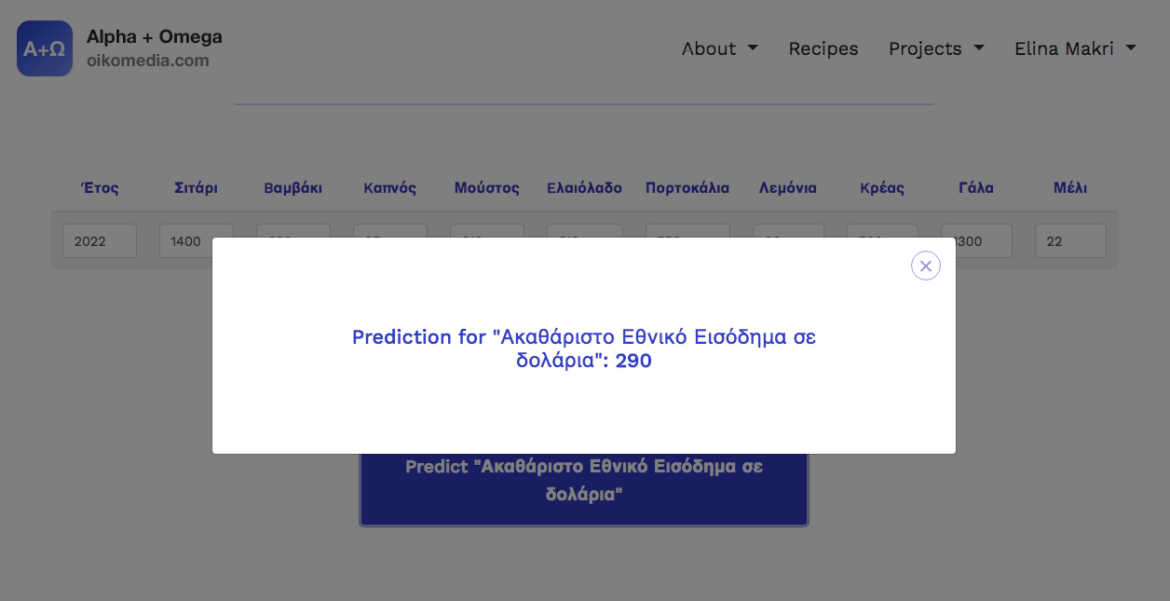
7. Click on predict Gross National Income in dollars to view the result of the forecast.
Artificial Intelligence and Journalism; the future is already here

The use of Artificial Intelligence systems by major journalism organizations.
Factors affecting the quality of the model and, subsequently, the result of the forecast include:
• The number of instances. The previous section listed very few (only 6) examples, however, if these 6 are found to be representative of the “truth” then the model will make correct predictions.
• The number of Features (the columns in our file). The more, the better.
• The type of Features. At least some of the Features in our file need to be representative of the “truth”. We usually do not know which ones they are; the Α+Ω recipe identifies them automatically.
• The selection of our file’s Features in relation to what we want to predict. For example, it seems reasonable to assume that grain production is more closely related to a country’s GNI than the annual number of marriages in a country.
•Predictions are not easy to make; they require experimentation and experience. Perhaps the most important aspect of forecasting is data modeling (the type of data we choose as Features/columns in a file):
• The number of columns needed: 2-3 columns will usually not suffice unless we are dealing with a very simple forecast. For example, if we want to predict the number of deaths caused by a pandemic, the number of cases and deaths reported in the previous days is not enough.
• The way data is linked to columns: We need columns that inform us about deaths that occurred in the previous days, e.g. “number of deaths on the previous day, number of intubations on the previous day, number of cases on the previous day,” etc. In other words, we need to adopt a time series approach. – And of course, the more data we have, the better.
If the result of our forecast still troubles us, then:
• We try to add extra Features.
• We add more instances/rows
• or we decide that we cannot make a satisfactory forecast based on the data we have at our disposal, which means we may have to change our topic or seek help from a specialist. The Α+Ω team assists users in modeling data and the topic under investigation efficiently.
* Η Ελίνα Μακρή είναι δημοσιογράφος και συνιδρύτρια της A&Ω

