Global food prices in 2022 still hit a record high since 1961, according to the UN Food and Agriculture Organization’s (FAO) latest food price index. According to the Organization’s latest monthly report, published on 6 May, the global food price index for April 2022 is 0.8% down compared to the previous month though still 30% increased compared to April 2021. The FAO food price index averaged 159,7 points in March 2022, being this year’s highest, and has been increased by 13,2% from the then-record in February 2022 before the Russian invasion of Ukraine. It is the highest month-to-month increase in the last three years. An indicative comparison reveals that the recent general price index is 60% above its pre-pandemic levels.
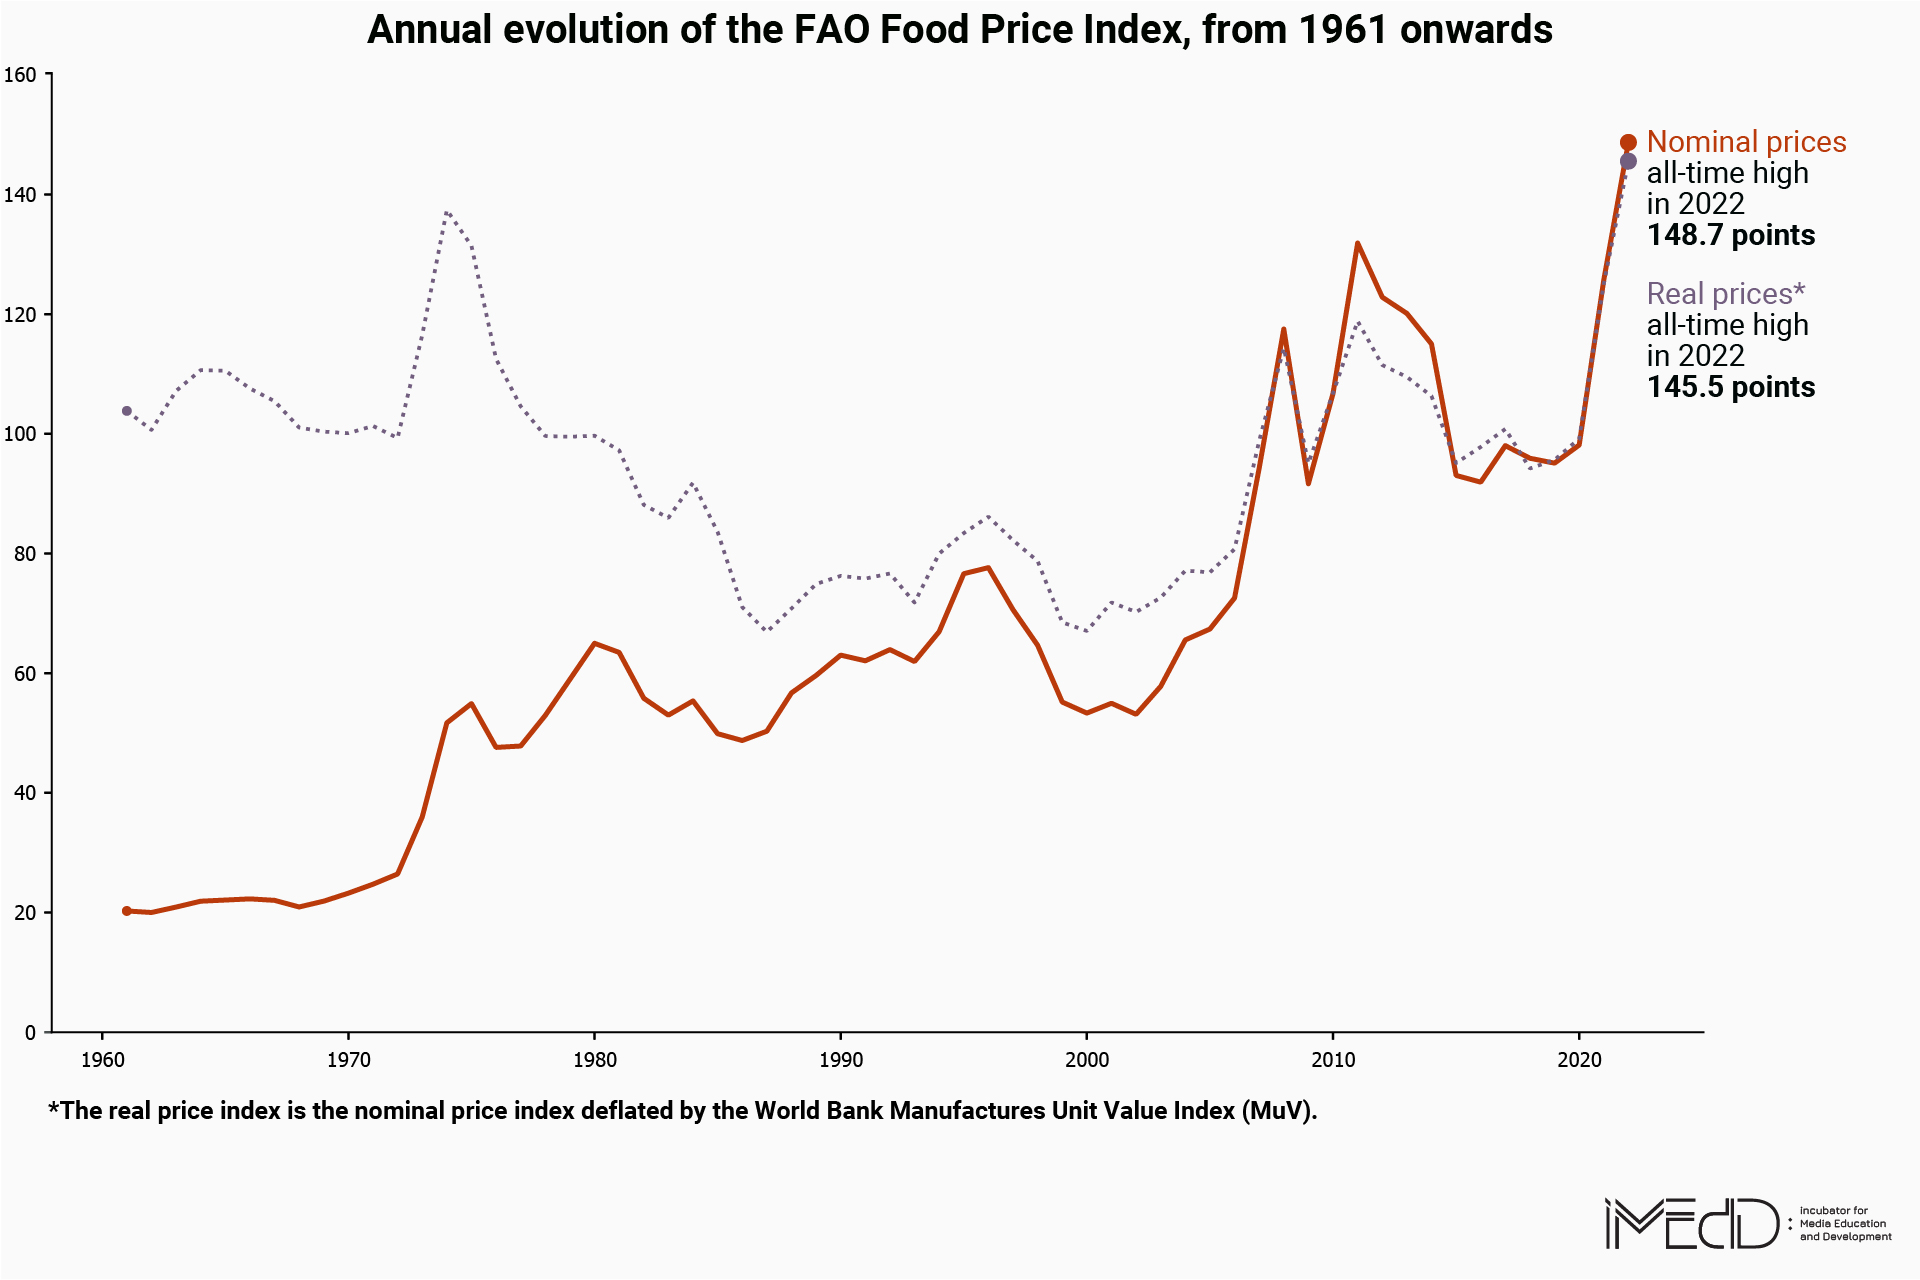
So far this year, the global food price index averages 148.7 points, the Food and Agriculture Organization (FAO) of the United Nations reported on Friday May 6th. As shown by examining the related annual data provided by FAO since 1961, the general index rises to a record high, regarding the international prices of the most traded food commodities (meat, dairy products, cereals, oils, and sugar).
The general index has made a leap to highest levels averaging 131.9 points in 2011, 125.7 points in 2021, 122.8 points in 2012, 120.1 points in 2013 and 117.5 points in 2008. This data relates to the general nominal price index. However, considering the general real price index as presented by FAO, deflated by the World Bank’s Manufactures Unit Value Index (MuV), a record high is set at 145.5 points in 2022, with the immediately preceding ones in the mid-70s (in 1974 at 137.4 points and in 1975 at 131.4 points).
It should be noted that the 2022 general index hits a record high based to a large extent to the March 2022 data, given that up to February 2022, the general nominal price index was set at 138.3 points and the general real price index at 135.4 points.
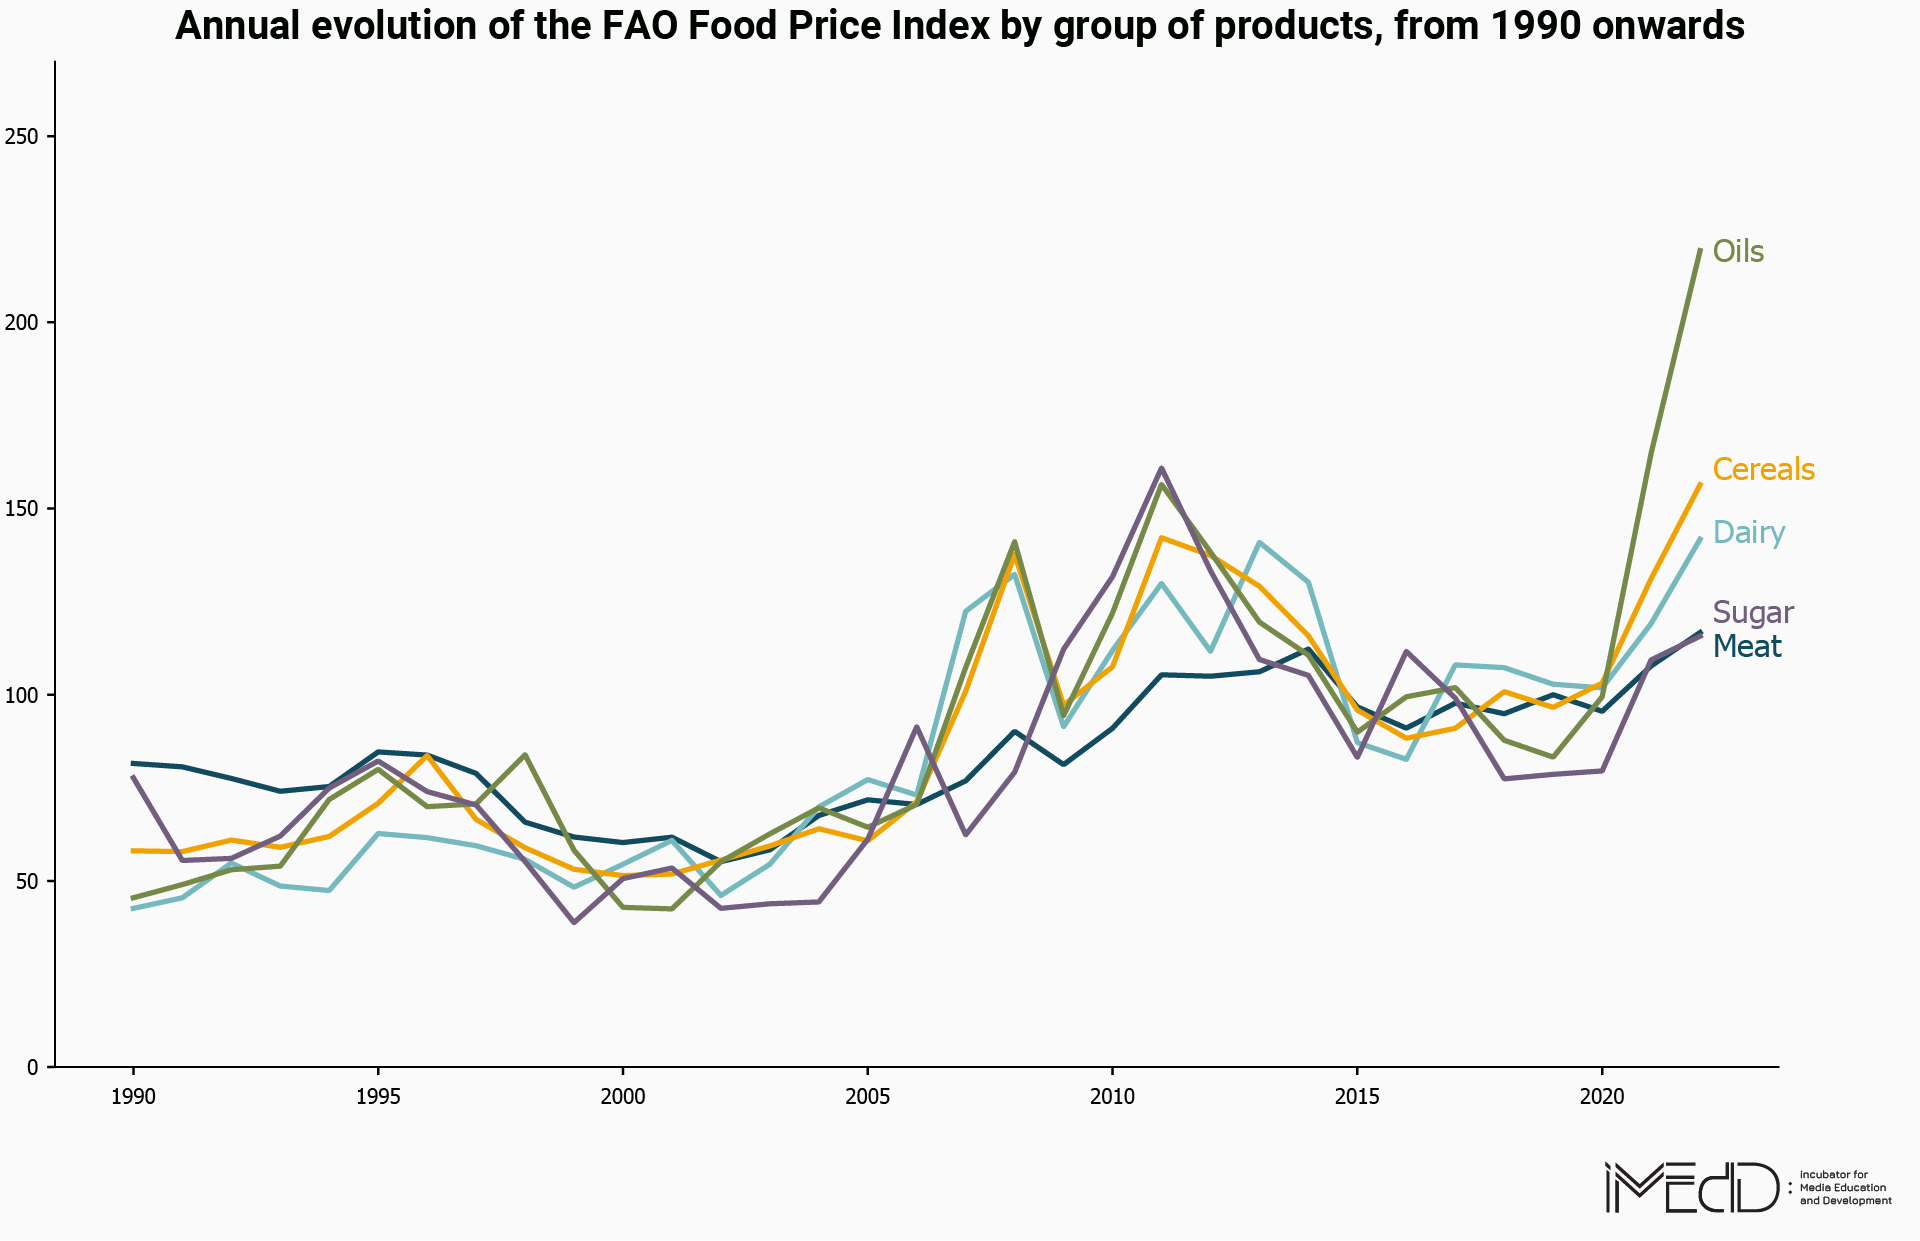
Considering the annual data on the evolution of the index per commodity group, provided by FAO since 1990, it is clear that vegetable oils appear to affect the sharp rise of the general index: in particular, the FAO oil price index averaged 219.3 points in 2022, up 33% from 2021, increased by 66% compared to 2020. World prices of cereals and dairy products have also increased significantly.
Focusing on the monthly data of the general nominal price index for the last three years, from April 2019 onwards, the highest price increase on a monthly basis is observed in March 2022, when the FAO food price index averaged 159.7 points, up 13.2% from February. Α large monthly increase of the general index was also observed in May 2021, up 5% from April 2021.
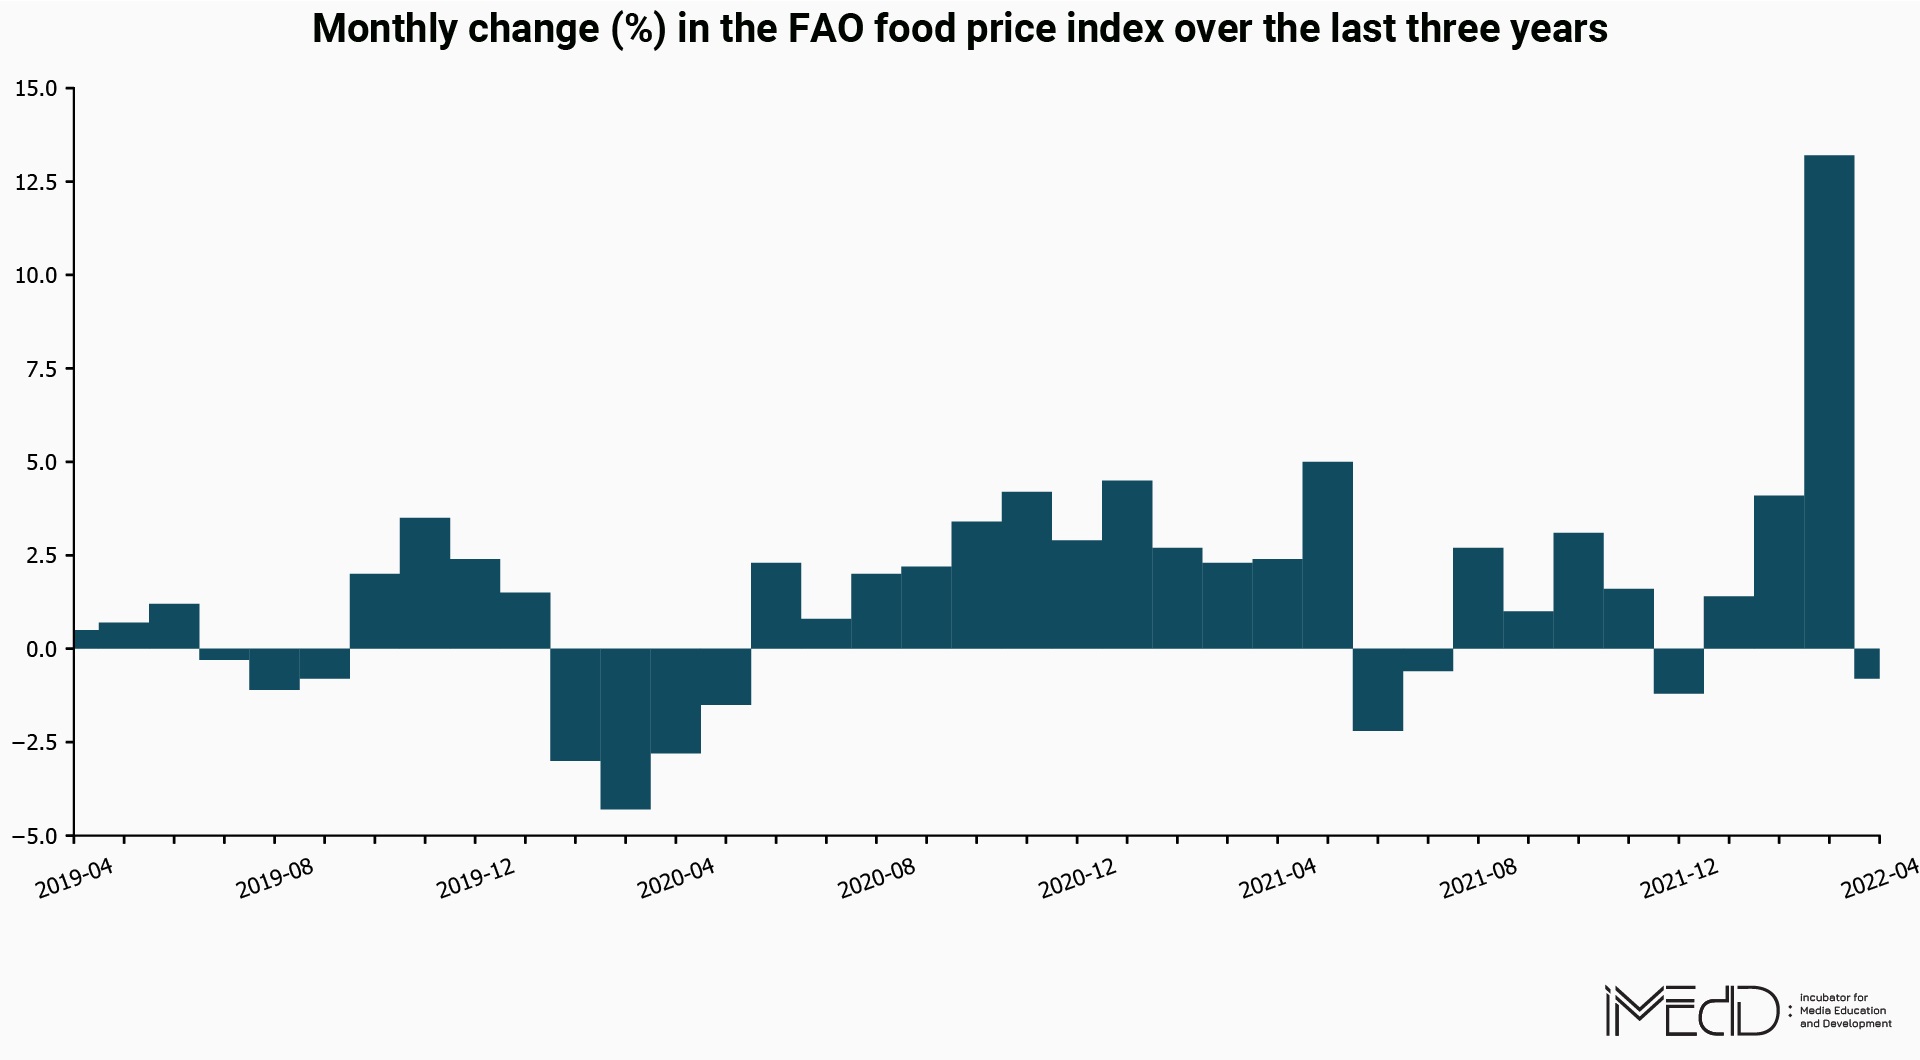
In April 2022, the general index decreased by 0.8% compared to the previous month (March 2022). However, it is up by 30% compared to the same month last year (April 2021), as shown in the visualization below.
The following table reflects the FAO food price index on a month-to-month basis from November 2019 to March 2022: the darker the color of each monthly field, the higher the value of the general index in the relevant month. At the same time, the table shows the percentage change of the general index compared to the previous month and also compared to the corresponding month of the previous year each time.
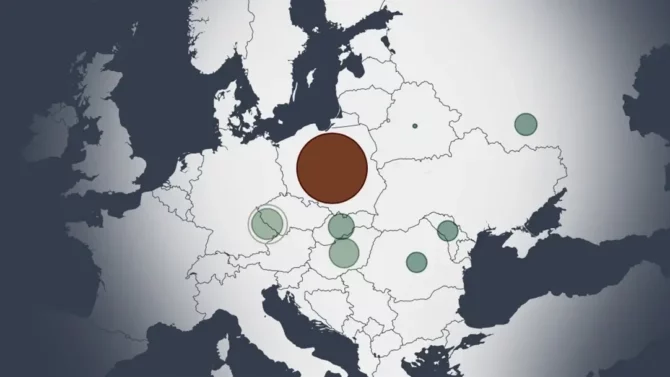
Europe welcomes Ukrainian refugees with an asylum system that averages more than 15 months of delay
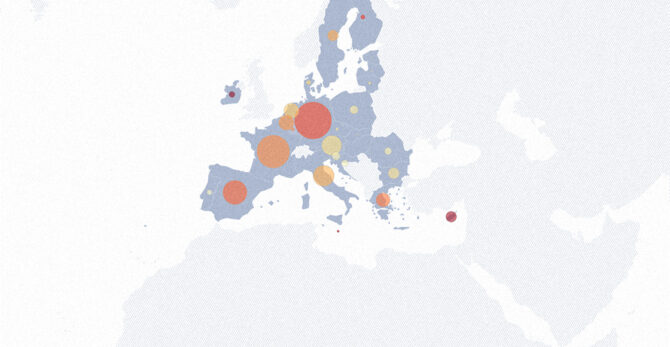
The asylum reception system in Europe is receiving millions of Ukrainian refugees while having more that 700k applications pending.
We have compared inter alia recent data on FAO food price index with data from February 2020, when the World Health Organization declared the Covid-19 disease a global pandemic: while in February 2022 the general index is increased by 42% compared to February 2020, both in February and in March 2022 after the Russian invasion of Ukraine a 60% increase of the general index is observed compared to the last monthly data before the pandemic.
It should be noted that February 2020 was randomly selected for the indicative comparison of the existing global price index with the pre-pandemic period. The comparison was made after verification of historical data, from which no seasonality of the increase or fall of the index was found; in other words, no change in the index was observed for a given month each year.
Information about the methodology for calculating the FAO Food Price Index
The FAO Food Price Index is a measure of the monthly change in international prices of a basket of food commodities. It consists of the average of five commodity group price indices weighted by the average export shares of each of the groups over 2014 – 2016. The five commodity groups taken into consideration are: cereals, vegetable oils, sugar, dairy products and meat. Contrary to other commodity groups, most prices used for the calculation of the meat price index are not available when the FAO Food Price Index is calculated and published. Therefore, according to the FAO, the quotations of meat price index for the most recent months consist of a combination of estimated and observed prices. This is likely to cause major revisions to the FAO indices from time to time. Detailed information about the commodities taken into consideration per food commodity group and about the methodology for the calculation of the index are available of FAO website and in the article “Revisions to the FAO Food Price Indices” included in the “Food Outlook” report published in June 2020.
This piece is part of the iMEdD’s Observatory on Ukraine, which can be found here.