
The Horror of War in Pictures
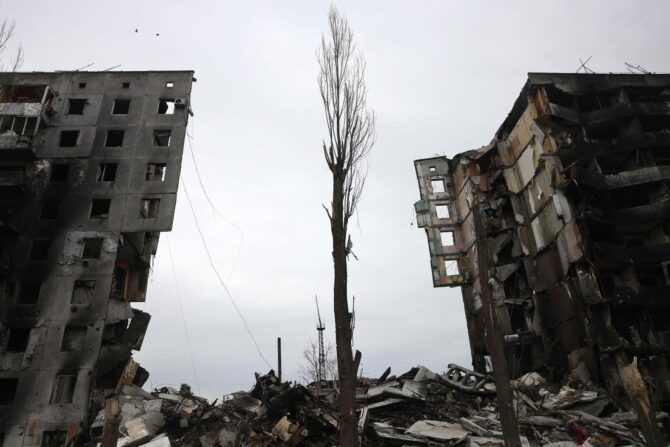
Giorgos Moutafis – images from Bucha, Borodyanka, Hostomel in the first days of April.
A platform developed by the Data and Web Science Lab (Datalab) of the Aristotle University of Thessaloniki (AUTh) analyzes the global conversation about the war in Ukraine on Twitter.
The Ukraine Data Observatory, a platform that aims at informing the international community about the global conversation on Twitter about the war in Ukraine, was launched and supported by members of the Data & Web Science Lab (Datalab), an active research group of the Department of Informatics, Aristotle University of Thessaloniki, under Professor Athina Vakali.
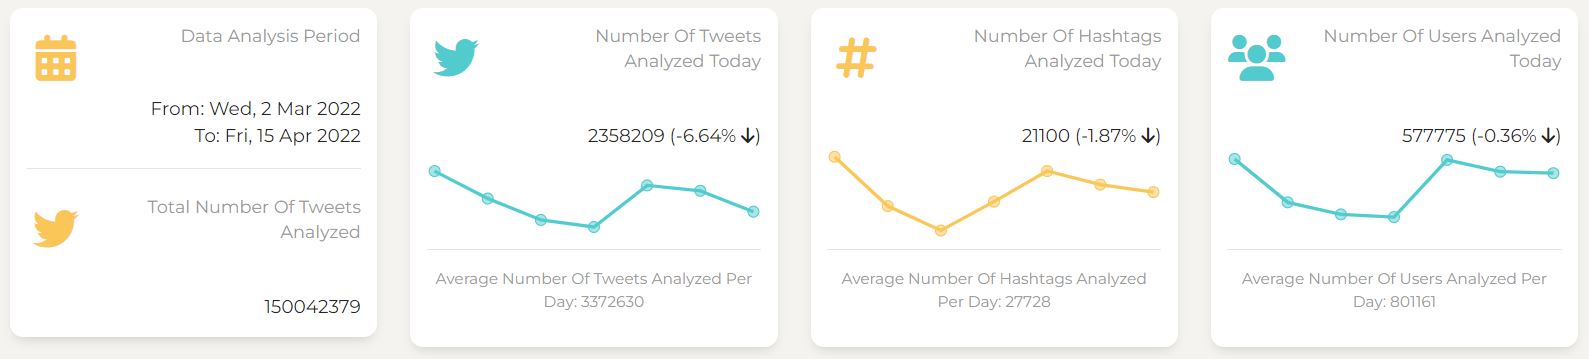
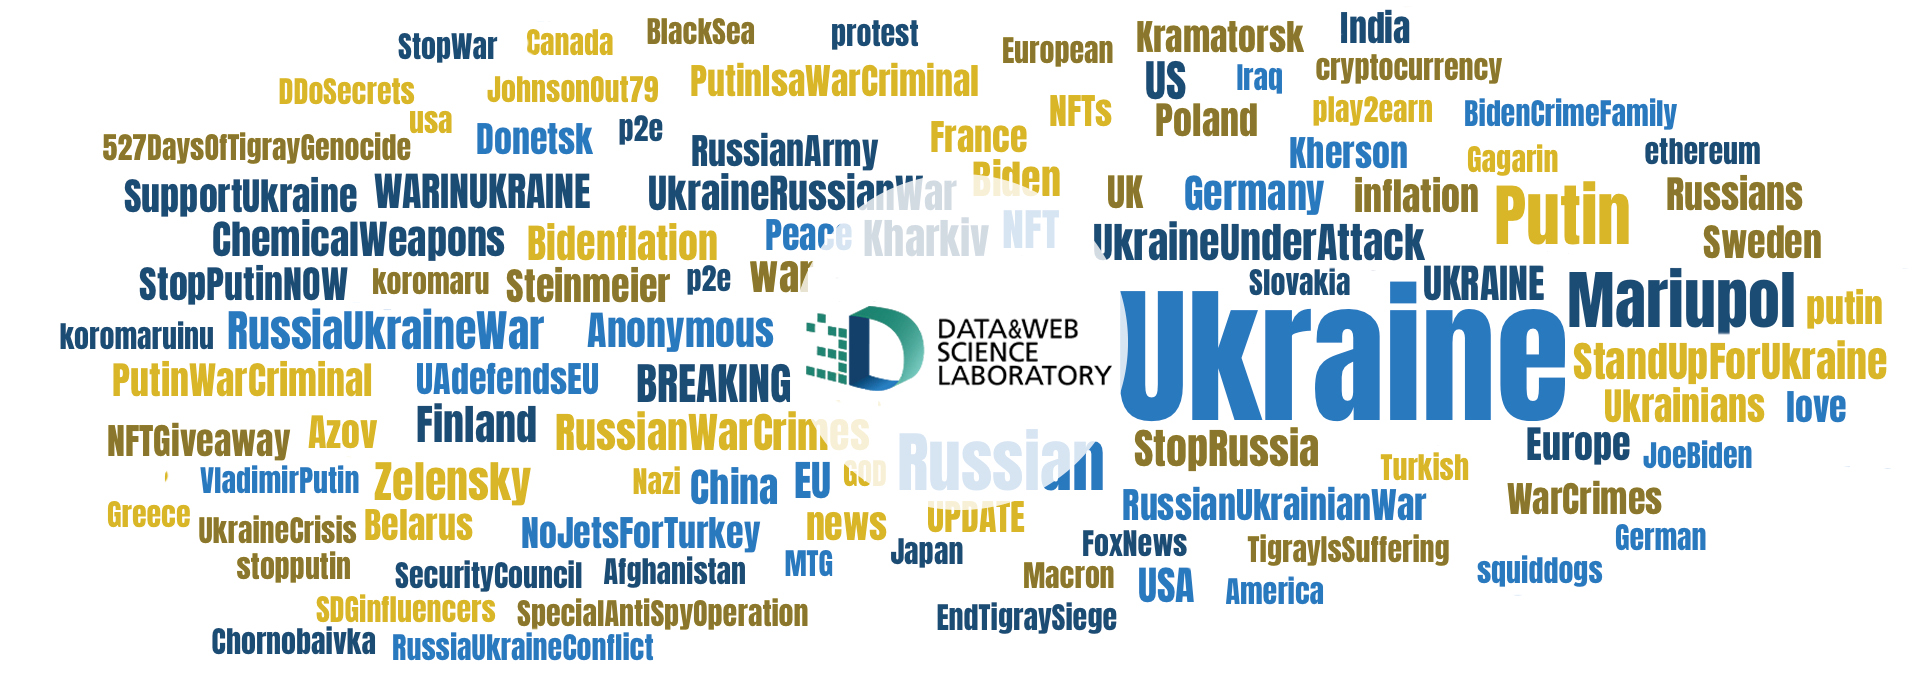
As long as access to Twitter and its “flagships” Meta, Facebook and Instagram, remain blocked in Russia, users worldwide keep (re)posting tens or even hundreds of thousands tweets per hour since the outbreak of the war. “However, is it so easy for people to follow -through Twitter- the developments on their own?” asks rhetorically the postdoctoral researcher and member of DATALAB, Pavlos Sermpezis, before telling us a few things about the lab’s initiative to develop the Ukraine Data Observatory, which was launched on March 2nd 2022: “We, who in fact started collecting tweets one week after the outbreak of the war, have collected over 120 million tweets about the war in Ukraine – and actual tweets may be 10 or 100 times more. So, it is understandable that the volume of data is huge: a user on his/her own, a journalist for instance, could not possibly retrieve all those tweets, however hard he/she searches, nor the most-liked ones or the topics discussed on Twitter. It is for this reason that we thought of developing the Ukraine Data Observatory. It is a program that collects all tweets related to the war between Ukraine and Russia, analyzes them and reveals the trends (the topics that concern users the most), the most popular hashtags, what do people talk about, what words are used, what are the most-liked tweets or those that are most re-tweeted, what articles users share most, who are the most active users on Twitter on this topic and who are the most influencing ones – who are the most listened. All these data are entered by us in the Ukraine Data Observatory, an online application that is accessible to all”.
Data collection and search filters
The members of the research group collect related tweets through the Twitter API (Application Programming Interface), a programming interface that can be used by anyone with programming skills to make “requests” on Twitter, requesting data from its databases. “Twitter has the merit of being the only social medium that provides this opportunity free and freely. It allows us, using a specific API function called “streaming API” (for more information, click here), to gather data, posted tweets, in real time”, notes the PhD candidate and researcher, member of DATALAB, Ilias Dimitriadis, explaining that data collection is a process that occurs concurrently with data analysis that also takes place in real time – with reasonable restrictions and based on methodological choices.
We have collected over 120 million tweets about the war in Ukraine –and actual tweets may be 10 or 100 times more.
The group constantly collects tweets by any of the 16 specific hashtags chosen by the researchers themselves (i.e. #Ukraine, #Russia, #UkraineRussiaWar, #RussiaUkraineWar, #Zelensky, #Putin – the list is available in the Observatory’s “About” page). “Provided any or many tweets contain (note: at least) any of the above terms, then we collect them and then analyze them”, notes Ilias Dimitriadis and adds: “Of course, Twitter does not give us all the said posted tweets, but only a small proportion thereof, with regard to which though research has shown that it is statistically valid and gives results”. He continues clarifying on one hand that Twitter returns to the user who makes programming “requests” for data about any topic of interest, from 1% to 3% of the content that is available in the social medium at the time of the request (in particular, within two hours) and on the other hand, this occurs on a random sample basis, without the platform choosing the specific content to be given, as described in Twitter API documentation. “That is why the analysis made is statistically valid, because Twitter does not select from a specific country or a specific user or a specific period which data it will give”, notes Ilias Dimitriadis. Moreover, he explains that as soon as the group collects data in this way, based on default reference hashtags, it carries out the analyses of the content identified as English-language.
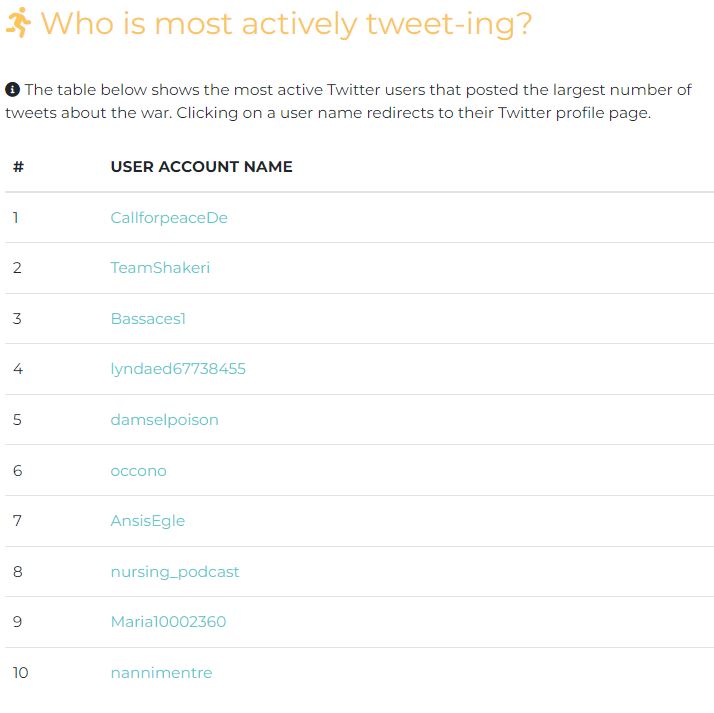
Top users, “influencers” and bots
One of the most interesting features of the application is the list with the top ten most active users and the one with the top ten most influencing users within any period selected. The most active users are those that post the largest number of tweets (tweets and/or retweets) about the war in Ukraine. On the other hand, the most influencing users result from the use of algorithms based on graph analysis and take re-tweets, mentions and replies recorded between users into consideration.
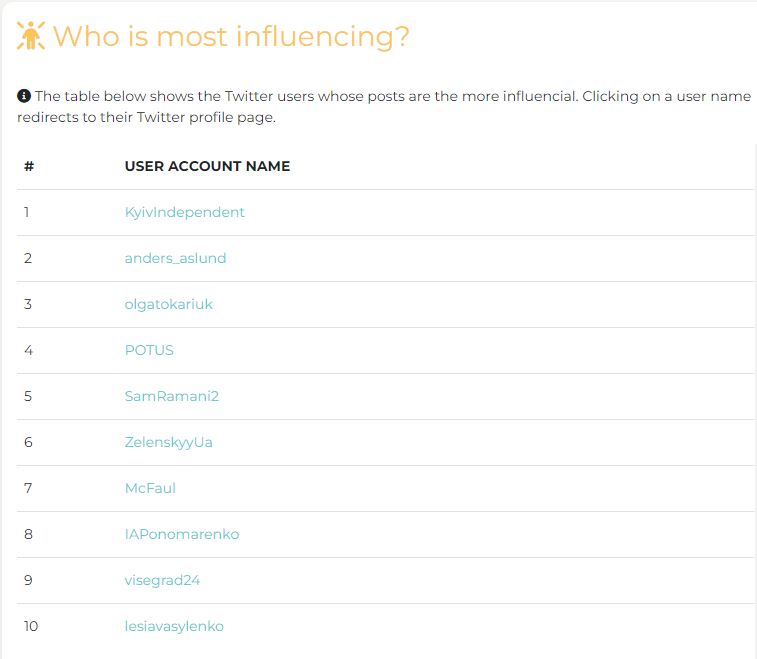
“A user may post 100 tweets a day, but if his/her Twitter follower network is not large enough or people are not interested in his/her posts, then they may not be so influential. However, a user may post less tweets, but they may get more views and re-tweets. From some results that we have seen, we noticed that there are major news websites in the most influencing users. For instance, there was the Kiyv Independent in the top [most influencing] users for many days, while this website does not appear in the most active users. On the contrary, we noticed that in the most active users there are accounts that post (or retweet) 500 or up to 900 tweets per day, which was much of a surprise to us at first”, explains Pavlos Sermpezis.
We noticed that in the most active users there are accounts that post (or retweet) 500 or up to 900 tweets per day.
That was the beginning, so that the research group would make use of its know-how resulting from the development of Bot Detective, the online tool that is an ongoing project of the Datalab and which checks the activity of s Twitter account and assigns it a percentage that refers to the probability of an account being human, bot or cyborg. As for the latter, these are accounts that may not correspond to an individual, but to a group of persons, an entity, an organization, a media outlet and so on and may publish content based on a process that is initiated by a human but it is (semi)automated.
For the purposes of the Ukraine Data Observatory, the group collects the 200 most active users and the 200 most influencing ones on a daily basis and publishes the top ten users per category in the application. On this basis and within the framework of research, the group analyzed the top ten users per category for the research period: Given that there are day-to-day overlaps (someone who is included in the top ten users one day does not stop his/her activity the following day), “Out of a total of 157 users among the top ten throughout this period, the 33 ones have been removed from Twitter”, notes Ilias Dimitriadis, indicating that more than 1/5 of these users have been practically considered at a later date to be bots by Twitter itself (or to be users that breach Twitter’s fair use policy). Of the remaining top users, “our tool indicated that only 41 were human” explains Ilias Dimitriadis and continues by saying that in accordance with the analysis carried out by the research group with Bot Detective, the remaining ones are some other kind of bot: accounts that keep publishing the same content (spam bots), political bots that are characterized by a specific pattern of behavior and words with capital letters, many exclamation marks and other bold characters, “bots” trying to imitate human behavior (social bots) and bots that declare they are bots (self-declared bots).
Out of a total of 157 users among the top ten throughout this period, the 33 ones have been removed from Twitter. Of the remaining top users, the Bot Detective indicated that only 41 were human. The remaining ones are some other kind of bot.
The above findings are the result of an ad hoc analysis carried out by the working group. Its immediate plans however include the “interconnection” of the know-how required for Bot Detective with the Ukraine Data Observatory, so that Observatory users would soon be able to see next to each account in the lists of top users the estimations for its “identity” – whether it is considered to be human, cyborg or some kind of bot.
For now, the application and the research group’s work in general highlight inter alia two standard open questions about the quality characteristics of public discussion in social media, especially at times of crisis.
Of course, the one question concerns the role of bots and the influence of public discussion: “There is no overlapping in the lists of top ten most active users and the top ten most influencing users”, notes Pavlos Sermpezis referring to the first indicative analysis “exercise” carried out by the research group. “I wouldn’t jump to the conclusion that discussion is not affected”, he adds and states that based on recent research, in general “10% – 15% of Twitter is bots and 25% of the content is shared by bots, given that bots tweet much more often than humans. As regards some topics, either key ones or of much more interest, like for instance the COVID pandemic, 50% of the content came from bots”. On the same wavelength, Ilias Dimitriadis refering to the case of conversation about Ukraine, says that “we haven’t checked, for instance, whether there is an overlapping between the top 100 (most influencing and most active users respectively). In other words, there may be a bot for example in the top 100 most influencing users”.
The second issue that also comes up for discussion through this particular research project concerning the distribution of information on social media, is whether social media have lost the initial – a decade ago – much promising information dynamics that emerges “bottom up” and the dynamics of message that is freely disseminated from many to many, without centralized control. “As for the most influencing users, we notice something else that is also very important: This month, the total number of users entered (at any time) in the (daily) list of top ten users is 41. We have analyzed them as well. Of them, only six turned out to be “human” (through the Bot Detective); the remaining ones were cyborgs” notes Ilias Dimitriadis – highlighting once again the current superiority of news agencies, established mass media, other organizations and entities in social media that once appeared as the radical force of paradigm shift in mass communication.
Translation: Tina Katoufa

