Skip to content
iMEdD logo iMEdD Lab logo
                 
  • ELECTIONS 2023
  • STORIES
  • OPEN DATA
  • APPLICATIONS
  • MULTIMEDIA
  • TOOLS & PRACTICES
  • ΕΛ
  • EN

Αναζητηση

iMEdD Lab

Methodology

How the application monitoring the spread of the disease was created

10.12.2020

Kelly Kiki, Thanasis Troboukis, Dimitris Papaevagelou
Χάρτης κρουσμάτων της Ελλάδας, λεπτομέρεια

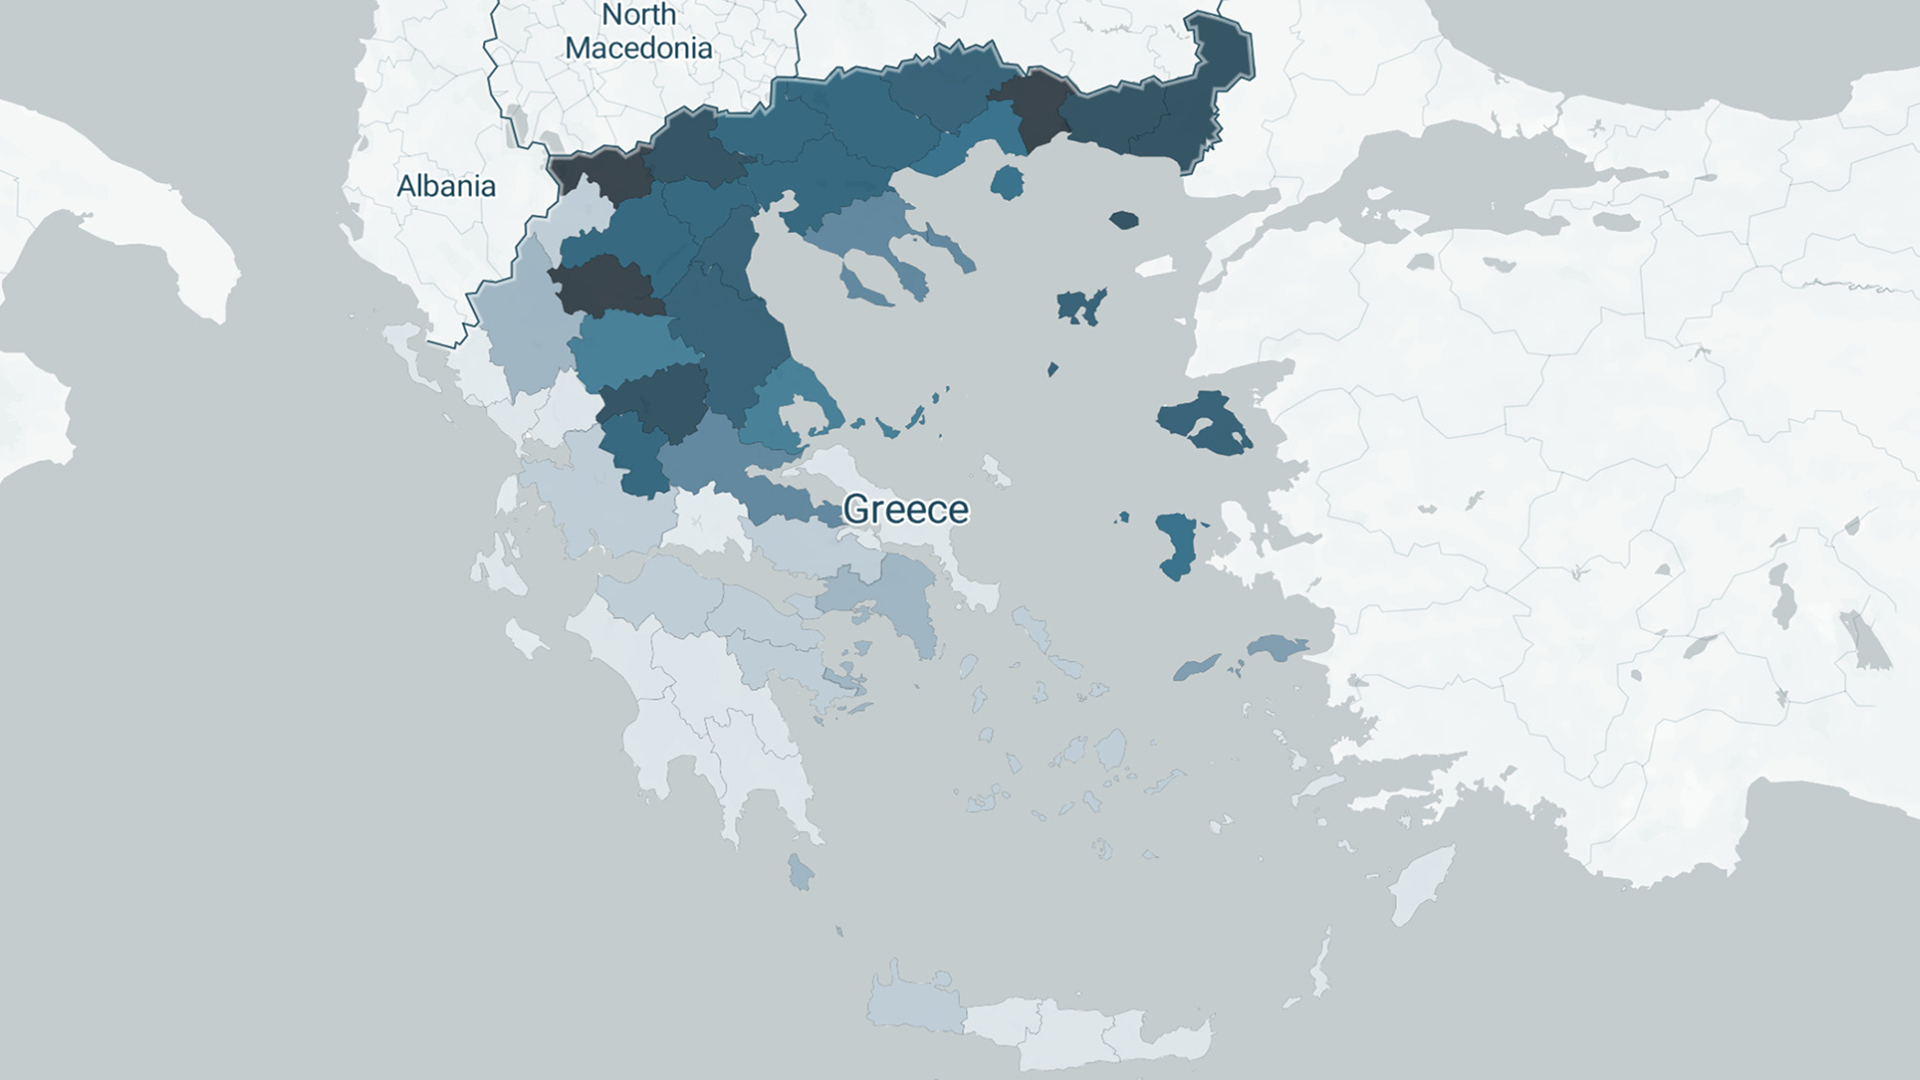
Work stages, sources/processing of data, tools and limitations regarding the development of iMEdD Lab’s web application tracking the pandemic in Greece and around the world.

Video

Mapping with QGIS: Part 3/4

10.12.2020

iMEdD Lab
cover image

How to perform basic geographic data analysis in QGIS.

Uncategorized

Mapping with QGIS: Part 2/4

10.12.2020

iMEdD Lab
cover image

Jonathan Soma explains how to visualize data in QGIS.

Methodology

Building the Lab website

09.12.2020

Kelly Kiki, Thanasis Troboukis
imedd lab logo

Working steps to developing the Lab’s website, designed to meet the needs of prospective users.

  • GitHub
  • Twitter
  • Facebook
  • Instagram
  • LinkedIn

Copyright © 2020 All rights reserved

  • About iMEdD LAB
  • Contact
  • Terms of Use
  • Privacy Policy
  • Cookies Policy
  • Cookie Settings