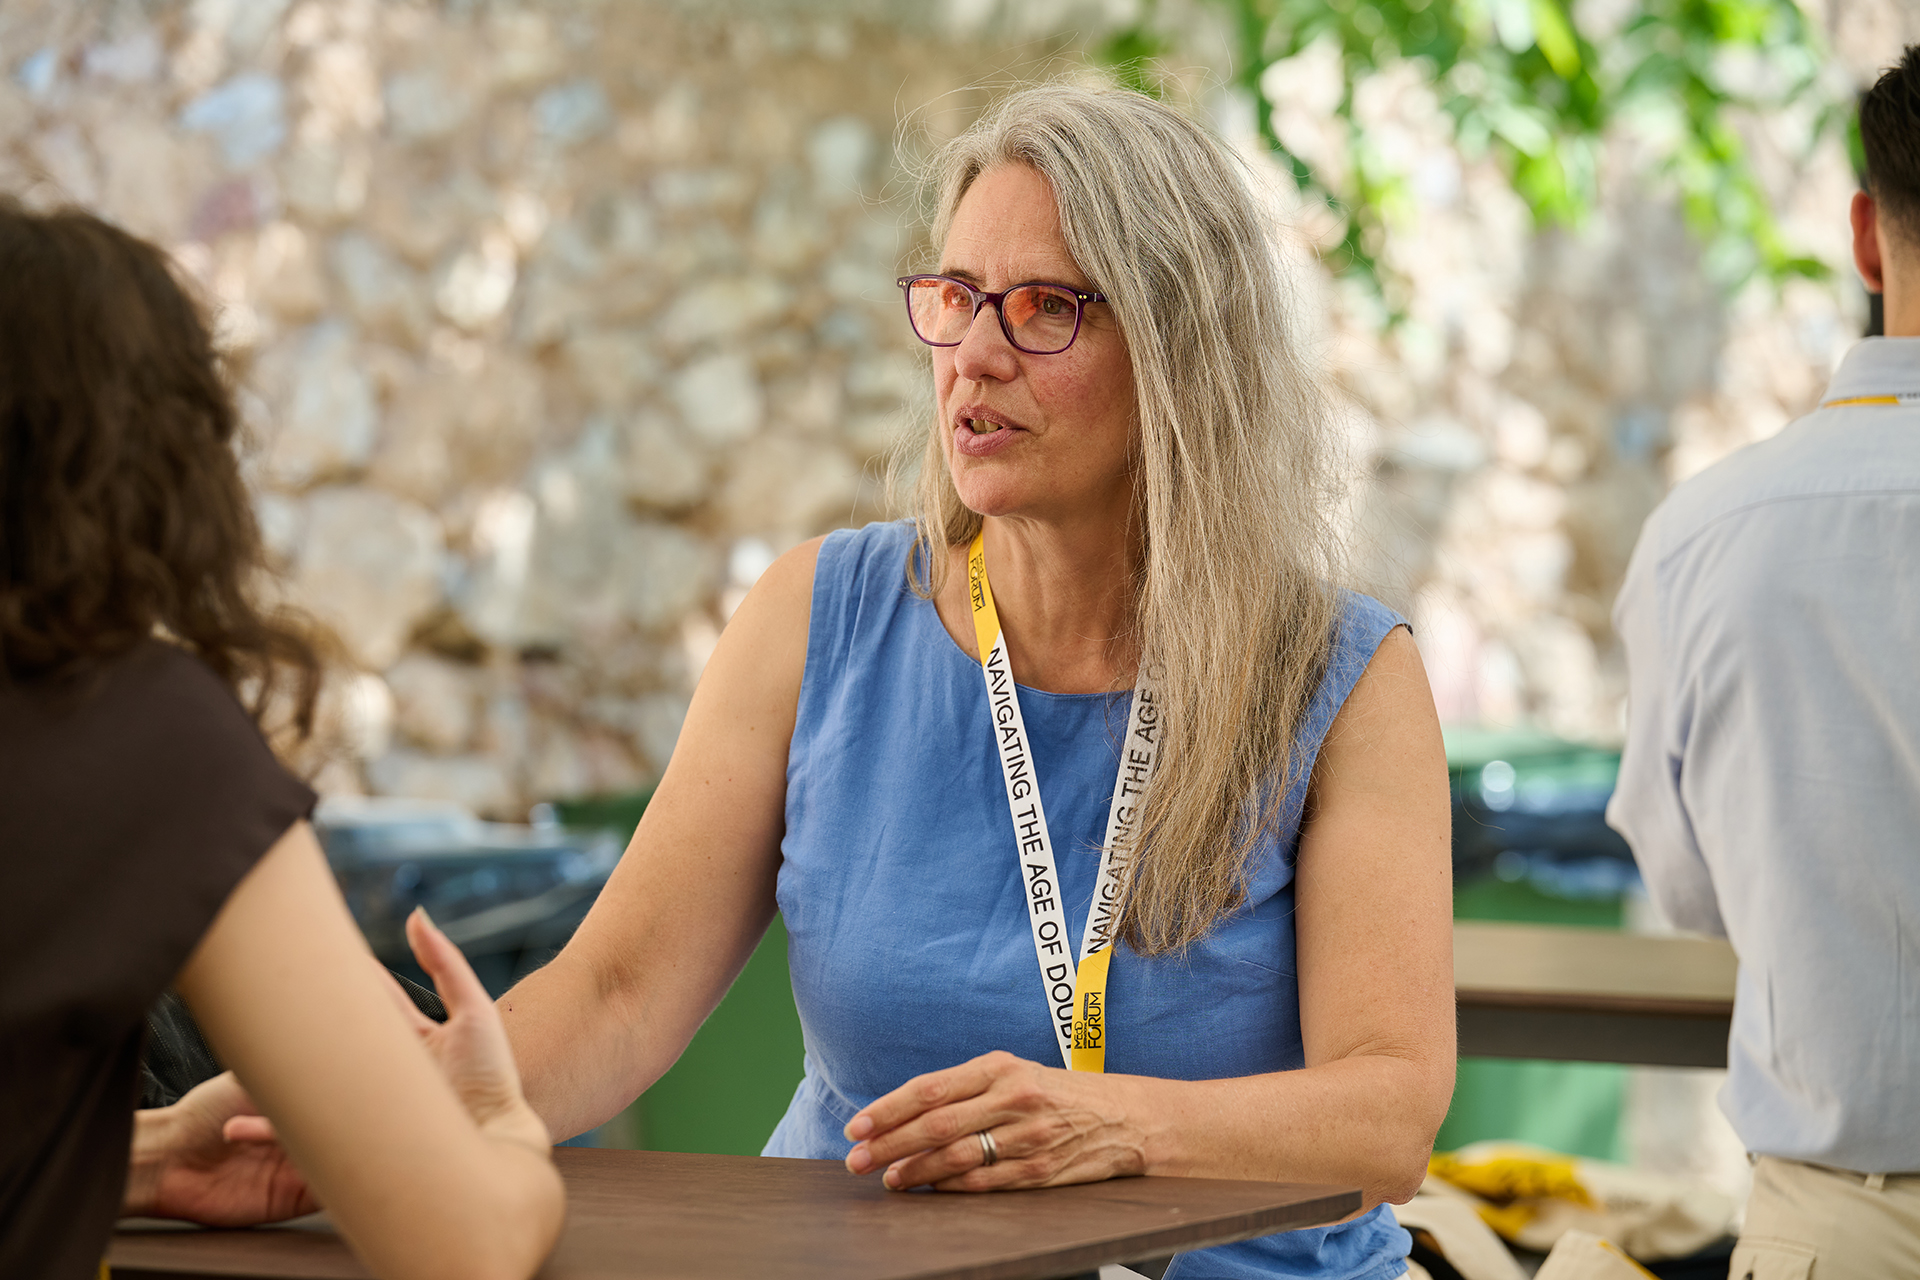
As climate change impacts communities worldwide, journalists who were present at the iMEdD International Journalism Forum 2025 shared strategies and tools to help turn attention to the planet’s most pressing issues.
Main Image: EPA/Francis R. Malasig
Environmental journalism is becoming increasingly relevant each year, as climate change affects thousands of people daily. Data and investigative journalists, and reporters specializing in environmental issues, shared with iMEdD their expertise on investigating how human activity impacts nature, as well as the tools and the techniques they that make their reporting more effective.
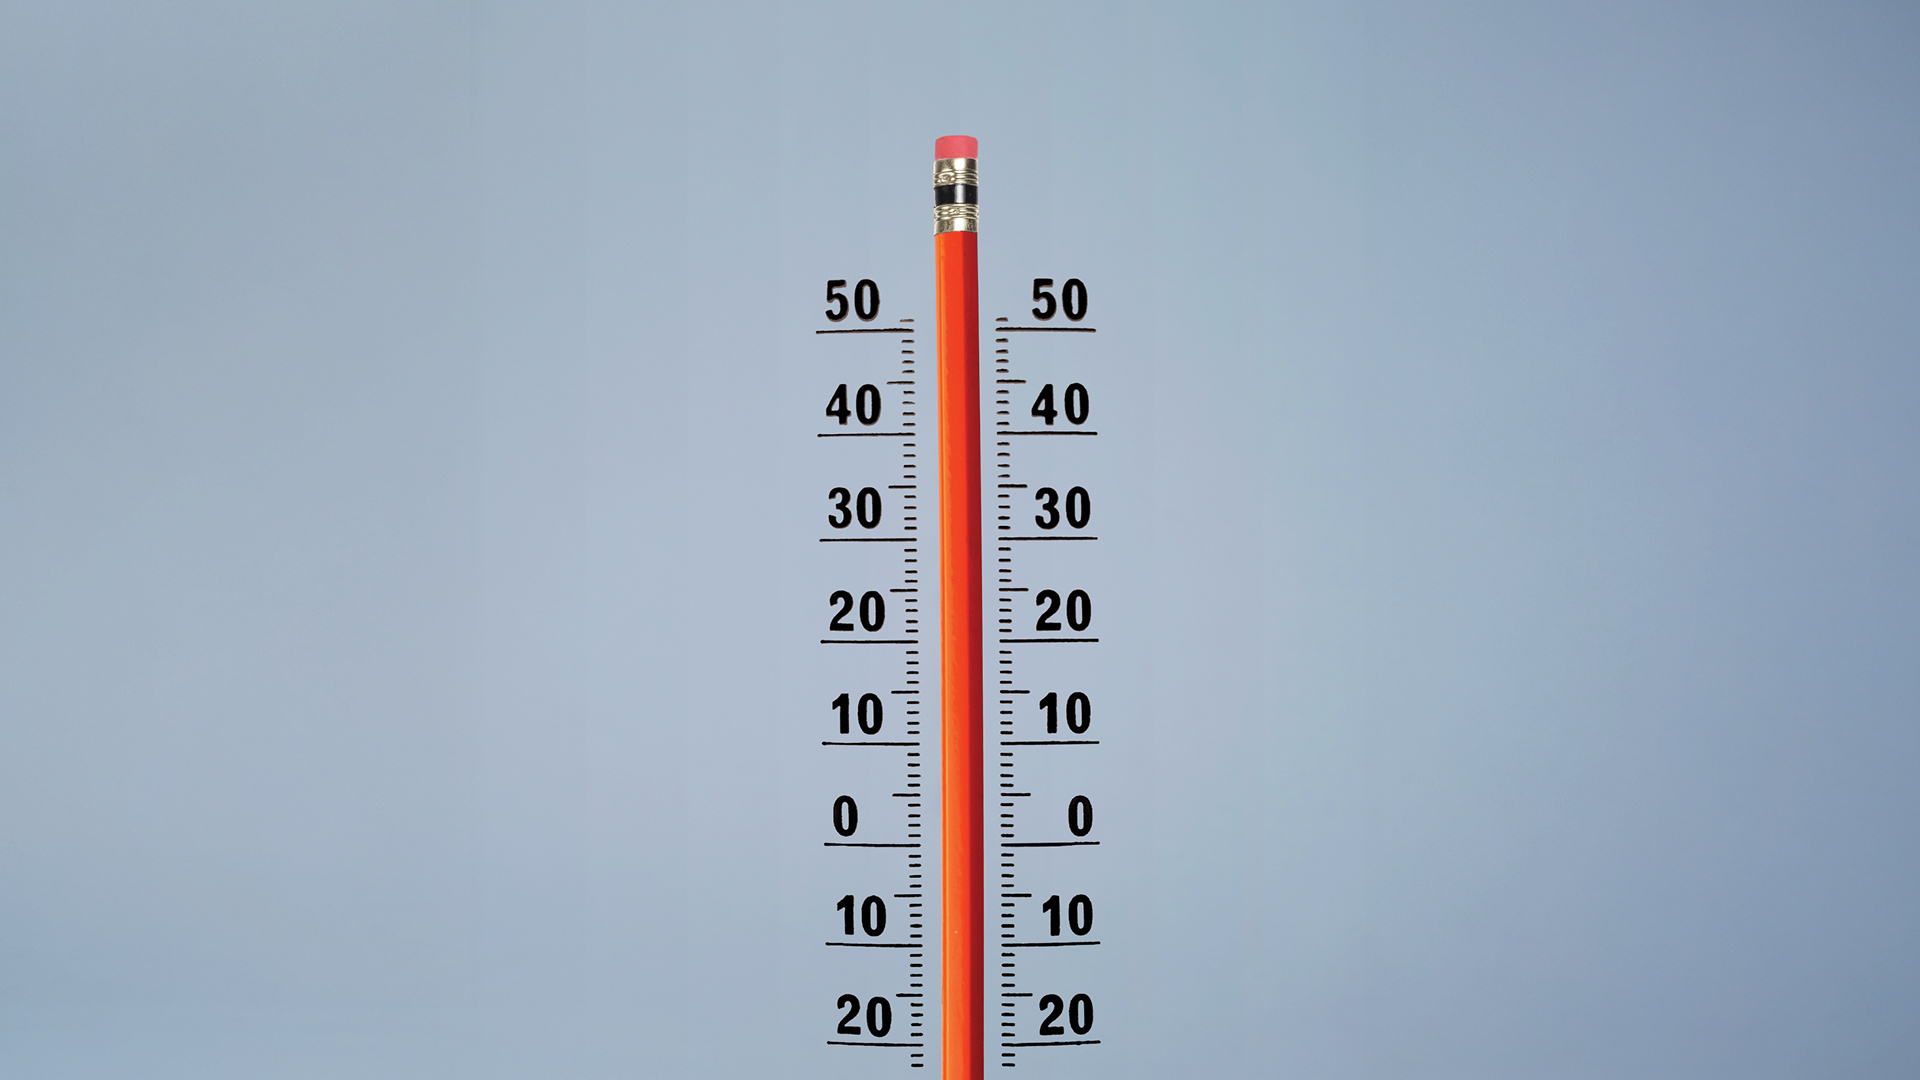
“Climate change is much more visible to most people now in their own lives, either because it’s hot or someone they know has been affected by flooding or wildfires or just a whole range of different kinds of impacts that people are seeing. And so, it’s much less a theoretical story”, Laurie Goering, Climate Change Journalist & Extreme Heat Editor for Climate Resilience for All mentioned at the start of our interview at the iMEdD International Journalism Forum 2025.
Bearing witness: Martha Mendoza on public service reporting
Pulitzer winner Martha Mendoza reflects on her career and landmark contributions to journalism in the public interest.
Advice from environmental journalists
- Stories appear when it’s about something you know
From a fishing community that has seen overfishing and wildlife trafficking to data centers using all the water from your area, stories appear when you know what you are looking at. Laurie Goering, has worked with and trained many young frontline journalists worldwide to develop their climate change stories, advises to start from one’s own interests and passions. “You are going to have natural sources and understanding of that [subject]. It helps to pick something that you care about and that you are interested in, maybe have some kind of entree too.”
- Don’t look too far. A story can be right where you are.
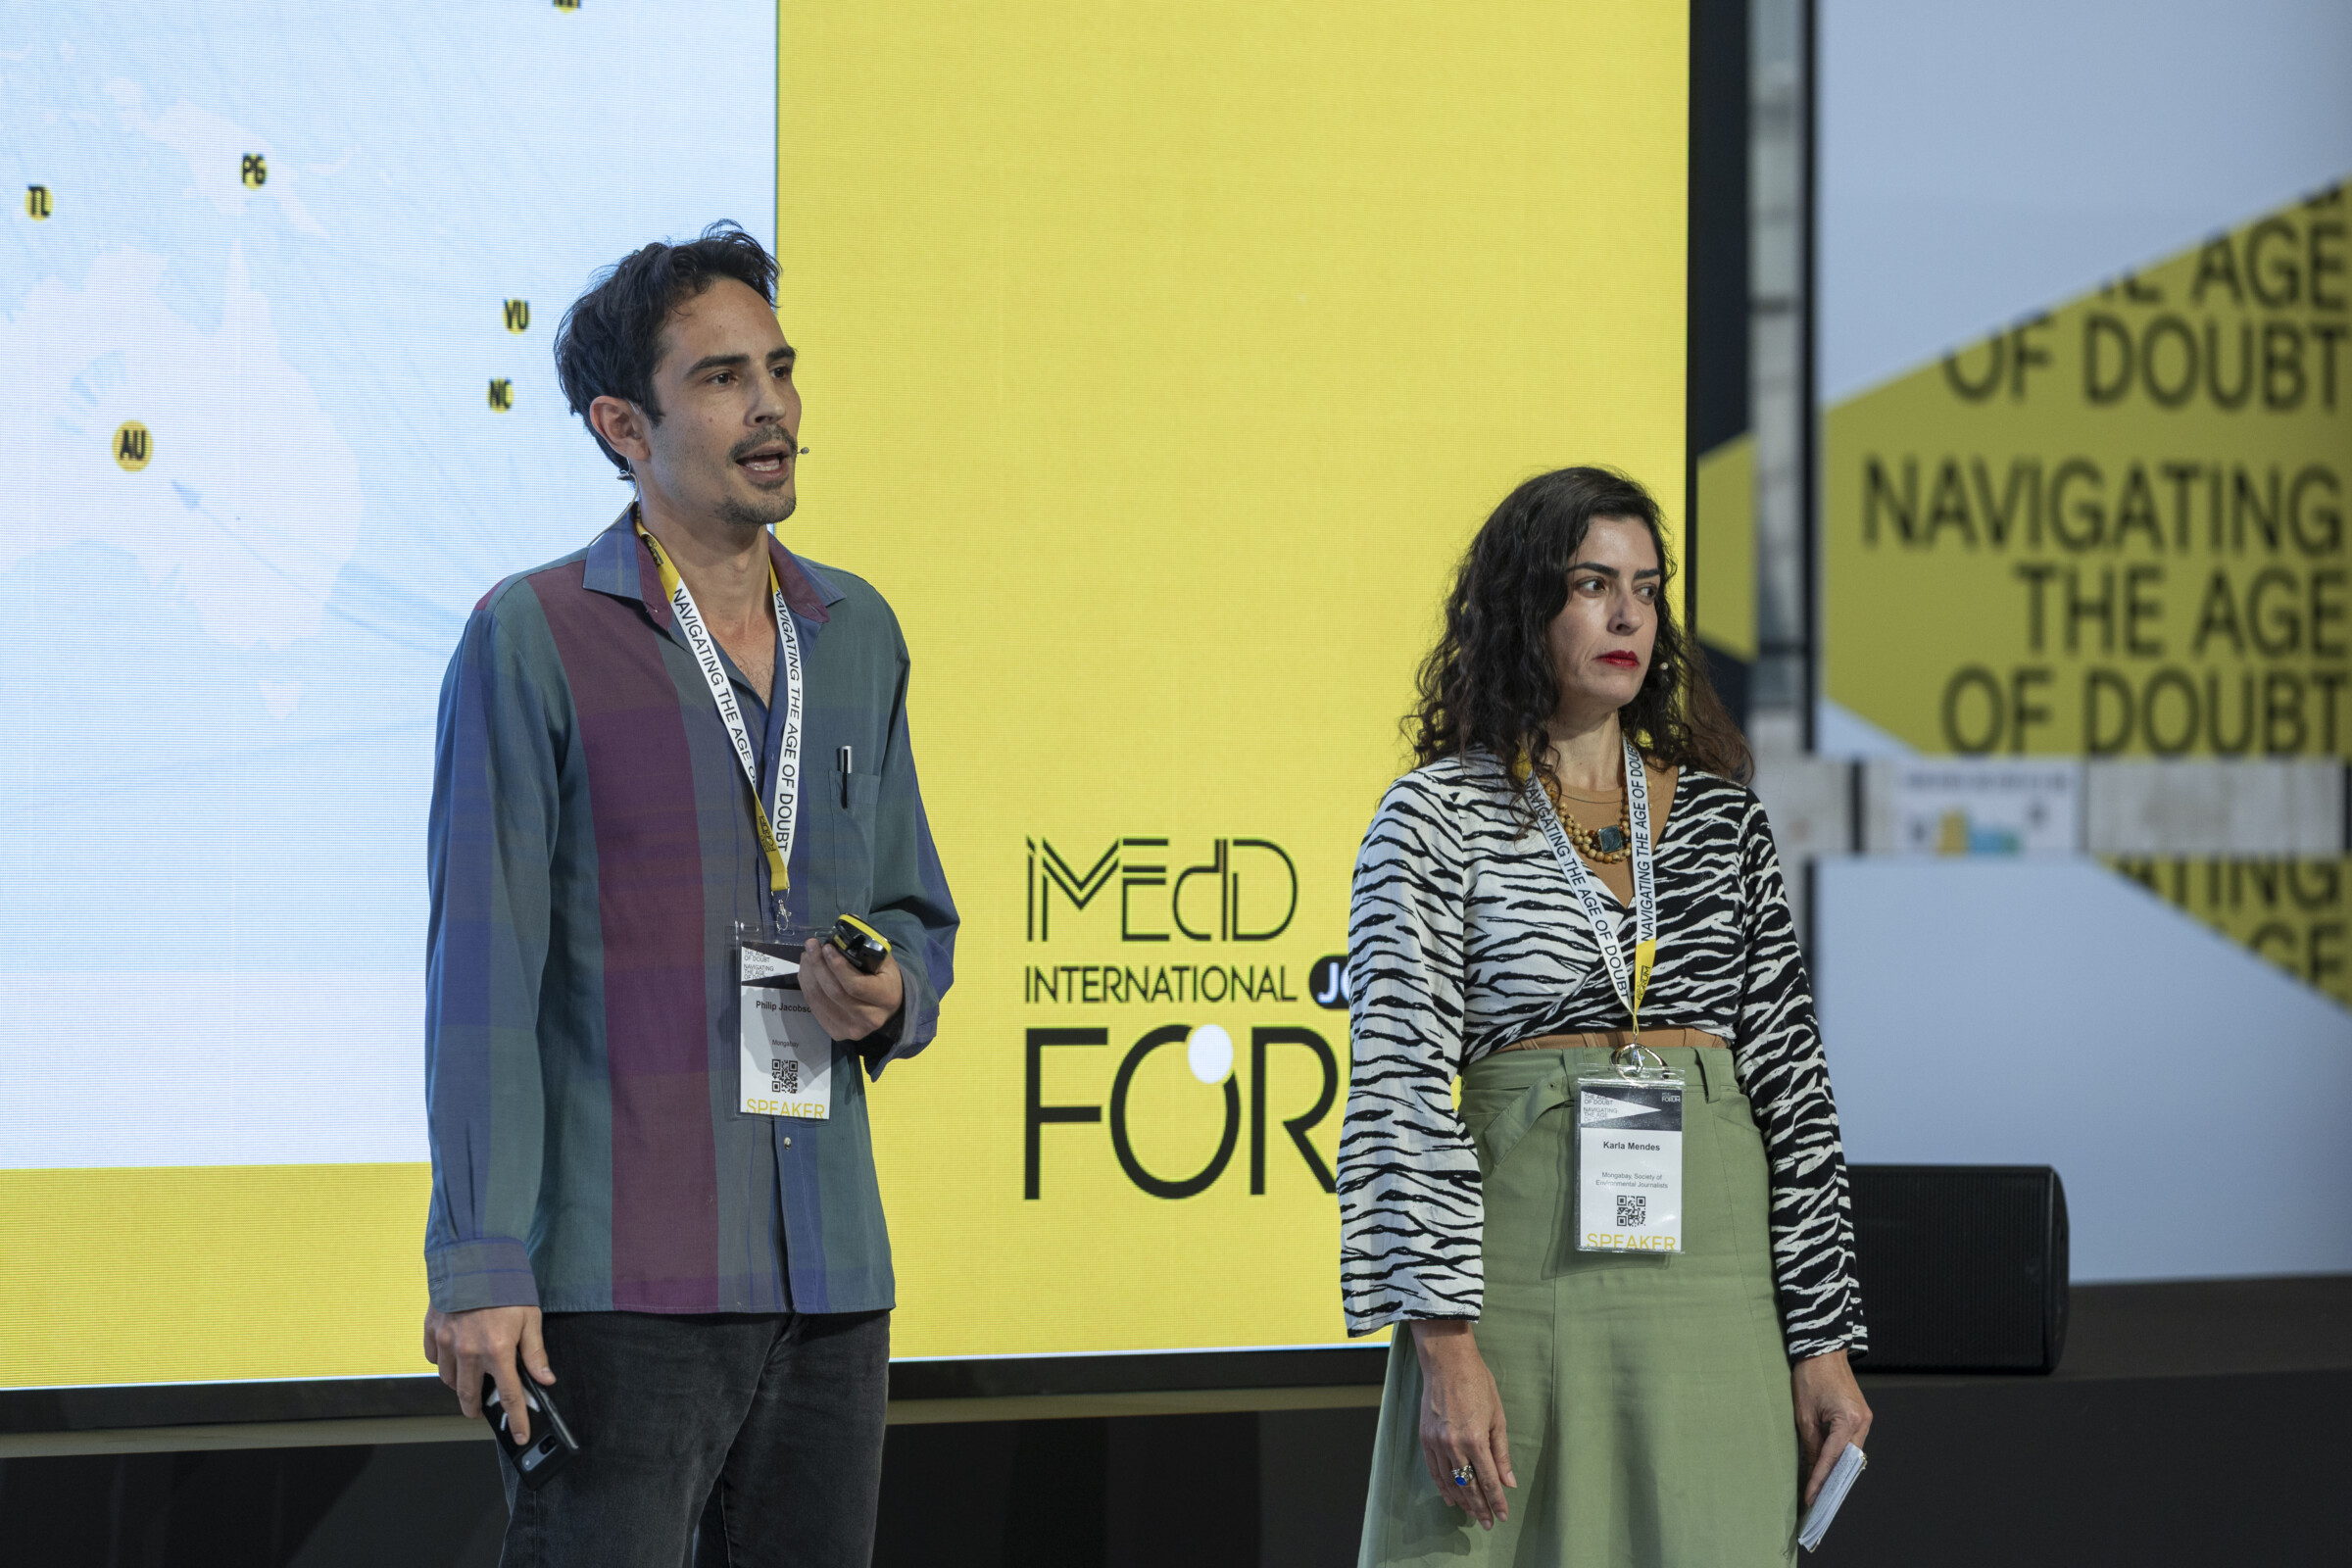
Perhaps you want to start looking into where the environmental stories you often hear about originate, such as in the Amazon forest or the ice glaciers, thousands of miles away from your country of residence. But the duo from Mongabay suggests otherwise. Karla Mendes, Investigative Reporter at Mongabay and Vice President of the Society of Environmental Journalists (SEJ), notes: “Look around where you are because environmental stories and injustice happen everywhere. […] Do the small well, and then keep growing […], to learn about your community, look at what is happening in your city […], build a relationship of trust with the locals”. Philip Jacobson, investigative journalist and senior editor for the environmental news site Mongabay, agrees: “Certainly, there’s no substitute for being in a place where these issues are happening and doing field reporting”, he admits. “But there’s also plenty you can do remotely from the desk”.
- When you are stuck, talk with the scientists
Before Laura Kurtzberg, Training Director at Investigative Reporters & Editors (IRE), started working on the award-winning story “Aquazonia”, a data-journalism project that maps and quantifies the cumulative human impact on aquatic ecosystems in the Brazilian Amazon, she and her colleagues were asking: “What’s different, what hasn’t been done before about the Amazon?”. Some scientists pointed out the problem of the freshwater impact, which nobody was reporting on. “People are focusing on the biodiversity loss, they’re focusing on the trees that are being cut down, the fires […] But we don’t see a big story about the water”, she says to iMEdD.
Sometimes, you are unsure if you actually have a good lead for the story or if it is too overused. For Kurtzberg, this is a good moment to turn to the scientific community. “I believe that many scientists are very excited to share their work if you express some interest. Because scientists are nerds and they are excited to see someone interested in their work, they often share their data and papers. […] They want to share [their researcher] with the wider world”. She suggests inviting scientists for a chat, presenting them with your story idea, and they will say your story matches what they are seeing in their research.
- Data can be anywhere… keep your eyes and ears open
When it comes to data about niche subjects, not all countries have a good track record at building databases. Laurie Goering remembers the story of a young reporter from northern Nigeria, who noticed that one very hot summer, there had been several heat-related deaths in the small place where she lived. Unfortunately, hospitals did not confirm her observation. “She couldn’t find any data”, Goering says. “She went out to the cemetery because in her culture, people are buried within a day of dying. And she looked at how many people were dying on average in the months leading up to that week, and then how many burials were there that week”. Doing the math, she managed to find her own data.
Journalists Laurie Goering and Philip Jacobson suggest that when no data exists, you can create your own by talking to the right people. While investigating the shark trade, Jacobson turned boat workers’ recollections of sack weights and shark meat counts into concrete estimates of the scale of shark fin harvesting.
- Maps are fun! Make more of them
Kurtzberg thinks that maps can add a lot to the story.” Seeing not only allows readers to understand where in the world the story is happening and is impacting people, but it also helps them form a sense of place and location, making a very abstract problem much more real, understandable, visually interesting and engaging”, she mentions. “People would like to see a map when something is very heavy and complicated, like a scientific problem. It becomes kind of fun to read, scroll through, and look at. And people can analyse for themselves, and they can look at it, and they can make connections, they become the researcher looking and trying to figure out the problem”.
Tipsheets from the iMEdDIJF25 – Part ΙI: Framing the story
Want to turn your data into sound, or transform your investigation into an interactive video game instead of a traditional video? This year’s Forum workshops provided a new set of tools and techniques to make your reporting more engaging and inventive.
What tools can one use?
Laura Kurtzberg shared a range of powerful tools and databases that have become essential for her environmental research. Here, we present a selection of these resources, along with others discussed during iMEdD’s International Journalism Forum. While some require coding knowledge, all are highly valuable for environmental reporting and can help make stories more insightful and impactful.
When working with maps, satellite images, and geographic coordinates, QGIS stands out as one of the most powerful tools available to journalists. The open-source software offers strong analytical capabilities for processing coordinates. Karla Mendez highlighted how basic digital tools can also play a key role in field investigations. During one of her reporting trips to the Amazon rainforest, she was able to create a map of an uncharted area simply by enabling her phone’s location services. “Through the photos you take, through the videos you take, with the coordinates you get, you can use them and do an analysis of that area,” she explained.
Mapbox is a powerful mapping platform that enables users to design and integrate interactive maps into websites and applications. With its API and customization options, it allows journalists to present geographic information in a visually engaging way. By combining design flexibility with geospatial data, Mapbox helps make complex spatial stories more accessible and interactive for the public. For her Aquazonia story, Laura Kurtzberg combined these mapping skills with Mapbox, to make the story more accessible to the public.
Google Earth Engine is a free cloud-based platform designed for large-scale analysis of geospatial data. It offers access to satellite images and allows users to process and analyse environmental changes over time. Laura Kurtzber says, “What you can do is use the cloud to do intense computing that you would normally would have to pay for. But Google provides it for free if you are a nonprofit and if you’re a journalist in certain categories”.
MapBiomas has free environmental data for South America. According to their website, it is a global, multi-institutional network formed by universities, NGOs, and technology companies that monitors changes in land cover and land use in different territories and their impacts.
Global Forest Watch is a monitoring platform that provides yearly information on the state of the world’s forests. Powered by data from the University of Maryland and other partners, it tracks deforestation, tree cover loss, and land-use change, with updates released on an ongoing basis. Its accessible interface and mapping tools make it a valuable resource for monitoring global forest health and informing conservation efforts.
The Copernicus Browser is an online tool that provides direct access to satellite imagery and Earth observation data from the Copernicus program. It enables users to explore high-resolution images and datasets related to land, atmosphere, marine, and climate monitoring.
The Copernicus data portals are part of the European Union’s Earth observation program, which provides free and open access to satellite data and services. These portals serve as gateways to collections of imagery and environmental datasets covering land, marine, climate, atmosphere, and emergency management domains. By making high-quality satellite observations openly available, Copernicus empowers scientists, policymakers, journalists, and the general public to monitor environmental change, track disasters, and support sustainable decision-making.
For the story “Troubled Waters”, which investigates the flooding phenomenon across Europe by Krisztian Szabo, Konstantina Maltepioti and Kostas Zafeiropoulos and was discussed in the workshop titled “How to use free satellite imagery and data to investigate natural disasters”, the Hanze Database was used among others. Hanze is a historical climate and disaster database that compiles detailed records of floods across Europe over the past centuries. From archival sources, scientific studies, and observational data, it provides a long-term perspective on extreme events.
EarthPress is a web-based platform that leverages artificial intelligence and Earth observation data to monitor natural disasters in real-time, presented by Alexandros Zamichos, research assistant at the Informatics and Telematics Institute of the Centre for Research & Technology Hellas (CERTH), during the workshop “EarthPress platform: Leveraging AI and earth observation methods for real-time disaster monitoring & automated news synthesis for journalists”. It combines Earth Observation (EO) data, AI-driven analytics, and Large Language Models (LLMs), to automate the process of gathering, and analyzing critical information from multiple sources—satellite imagery, news articles, and social media. The platform automates the process of gathering, analyzing, and synthesizing information, making it easier for newsrooms to deliver disaster coverage.