
The data, their processing, analyses and visualizations in the application “Auctions in Greece since 2018”.
How do auctions change Athens?

In the first episode of the “Data on the Record” podcast, we discuss one of the most important social issues, together with data journalist Sotiris Sideris.
The iMEdD Lab’s web application “Auctions in Greece since 2018” was created and maintained for the purpose of informing any interested party of the evolution of auctions in our country, where auctions take place exclusively via the online auction service from February 2018 onwards, but also with a view to facilitating the work of journalists and scientists in general. It was published in October 2021, following an earlier journalistic analysis carried out by iMEdD Lab in June 2021, and is being updated with new information on a monthly basis – on the 10th day of each month.
This application shows the evolution of auctions over time, their distribution by type of property, the geographical distribution of auctioned properties, but also the classification of municipalities according to the number of auctioned houses within their boundaries. Moreover, the application shows the top-20 hasteners, namely those who have initiated the most auctions, the share of banks, offshore special purpose vehicles1 and domestic servicing firms2 in speeding up auctions, as well as an estimate on the percentage of debts that may have been repaid –considering on one hand, the total claims of the hasteners and on the other hand the starting prices in a sample of completed auctions.
The data
All the analyses set out in the application are based on publicly available information displayed in the online auction platform eauction.gr. The iMEdD Lab has studied almost all auctions whose display in the platform dates from September 2017, while it continues to study new auctions made available daily.
These data are processed using Python programming language. Apache TIKA library is used for extracting available data from published .pdf files. At the final stage of data processing and before being stored in a database, data anonymization with the method of “hashing” in accordance with the recommendations of the Open Web Application Security Project (OWASP) on the storage of codes or sensitive data (see “Peppering”, “Salting” and bcrypt). The iMEdD Lab’s application does not share any kind of demographic or personal information about hasteners, debtors or other parties involved in the cases concerned. The only non-anonymized data shared by the application are the company names of banks, special purpose vehicles and credit servicing firms involved in speeding up auctions.
Analyses and visualizations
The chart “Evolution of auctions over time” reflects the total number of scheduled auctions per week from January 1, 2018 onwards. The default option “All” for filter “Status” means that the graph reflects all the scheduled auctions that had been available on the platform eauction.gr by the date of last update of the iMEdD Lab’s application; including completed auctions (that have already taken place), auctions posted – scheduled to take place in the time ahead, canceled auctions (a scheduled date had been set, but auctions did not take place), suspended auctions (auctions with a fixed date, but being suspended).
By selecting “Completed” from filter “Status” in the chart, the latter is adjusted to render only the conducted auctions. Note that these are the auctions that are reportedly “Completed”, according to publicly available data on the eauction.gr. platform. Auctions which are marked as “Completed – Canceled due to lack of bidders” on the platform (approximately 5,000 as of early November 2021) are counted as canceled by iMEdD Lab and are not included in the auctions displayed when the user selects “Completed” in the said “Status” filter.
By selecting “Bank involvement” (option available from filter “Hasteners”), the chart is adjusted to reflect the evolution of auctions that have been sped up either by banks or by companies that are linked to bank portfolios (for instance, offshore special purpose vehicles that claims on bank loans and credits have been transferred to them). Bank involvement is estimated in a programmatic way and, therefore, there is a margin of error. The above options function accordingly in any chart where these options are available.
The map “Geographical distribution of property auctions” illustrates the auctions of property, including houses, plots, land, offices, hotels, etc. (see filter “Type of property” on the map) by regional unit or prefecture across Greece, on the basis of the following calculation:
(number of property auctions in the region / total property auctions) * 100
In other words, the strongest red the color of the geographical area concerned is, the higher the percentage of properties auctioned there out of auctioned properties as a whole is. The analysis is based on a sample of property auctions that the municipality in which they are located is known according to publicly available information on the platform eauction.gr. Geospatial data from geodata.gov.gr (Base Layers/ Administrative Boundaries/Boundaries of Prefectures) have been used for the development of the map.
The table “Top 20 hasteners” includes a classification of the hasteners that are deemed to have initiated most auctions from January, 1 2018 onwards. Hasteners are indicated on the basis of publicly available information about the speeding up of each auction: for instance, there are auctions where it is explicitly referred to in the online auction platform that they have been sped up by an offshore special purpose vehicle, which is the successor of a bank (namely, it has acquired claims on bank loans and credits) and is represented in Greece by a domestic credit servicing firm. In such cases, the hastener is shown in the table in the form of a Special Purpose Vehicle – Bank – Credit Servicing Firm. Accordingly, there are auctions where no possibly involved bank is indicated in the platform, but it is referred that they have been sped up by an offshore special purpose vehicle, represented in Greece by a credit servicing firm. In such cases, the hastener is shown in the table in the form of a Special Purpose Vehicle – Credit Servicing Firm. Where hasteners appear with bank names, this implies that the bank concerned has sped up the respective auction. Where a hastener is shown in the table as an “Encrypted entry”, this means that it is a natural or a legal person that has been anonymized during the processing of data and does not appear in the application.
The chart “Hasteners and debtors in completed auctions” indicates the distribution of hasteners and debtors into legal persons (including banks) and natural persons, considering only auctions that have taken place from January 1, 2018 onwards. The hasteners – debtors classification is carried out secondarily by iMEdD Lab, based on publicly available primary information and using “Regular Expressions” in Python. This process forms part of the processing of data, before their anonymization and storage. Due to the fact that this classification takes place in a programmatic way, there may be errors and therefore, there is a margin of error. There are auctions with multiple hasteners and/or debtors of different classes. In this case, hasteners and/or debtors are classified as both legal and natural persons. Therefore, the sum of the hasteners and/or debtors might be greater than the total number of completed auctions. Auctions initiated by entities (such as the Independent Authority for Public Revenue, institutions, universities, local authorities, etc.) or against entities are few compared to the total number of considered auctions and are not presented in the graph.
The graph “How many claims are being repaid” illustrates an assessment made by iMEdD Lab on the number of debt cases linked to natural persons, which is estimated that they could have been repaid, at least based on the starting prices of the auctions under study. This analysis is based on a sample of completed auctions relating to property owned by individuals, for which it has been possible for iMEdD Lab to obtain information on one hand about their starting price and on the other hand, about the total claim of the hastener. These data are extracted from publicly available information using also “Regular Expressions” in Python and therefore, there is a margin of error. The secondary calculation of debts that may have been repaid is made as follows: At first, all the starting prices linked to a date case are taken into account – considering that in the majority of cases multiple auctions have been initiated for the same debt case. Then, the total claim of the hastener is taken into account (and not the amount for which each individual auction was carried out). If the difference between those two (sum of starting prices less total claim in a debt case) is positive, then this debt shall be considered to have been repaid after the completion of the auctions concerned. The number of these cases out of all cases that form the sample of the above analysis represents the estimated percentage of debts being repaid.
Residential property accounts for 38% of personal assets “lost” in auctions linked to banks

In the last 3.5 years, more than 46 000 auctions have taken place via the online auction service. In 66% of cases, multiple auctions were required to settle a single debt, and in half of the cases, debt repayment was not possible, based on the starting price.
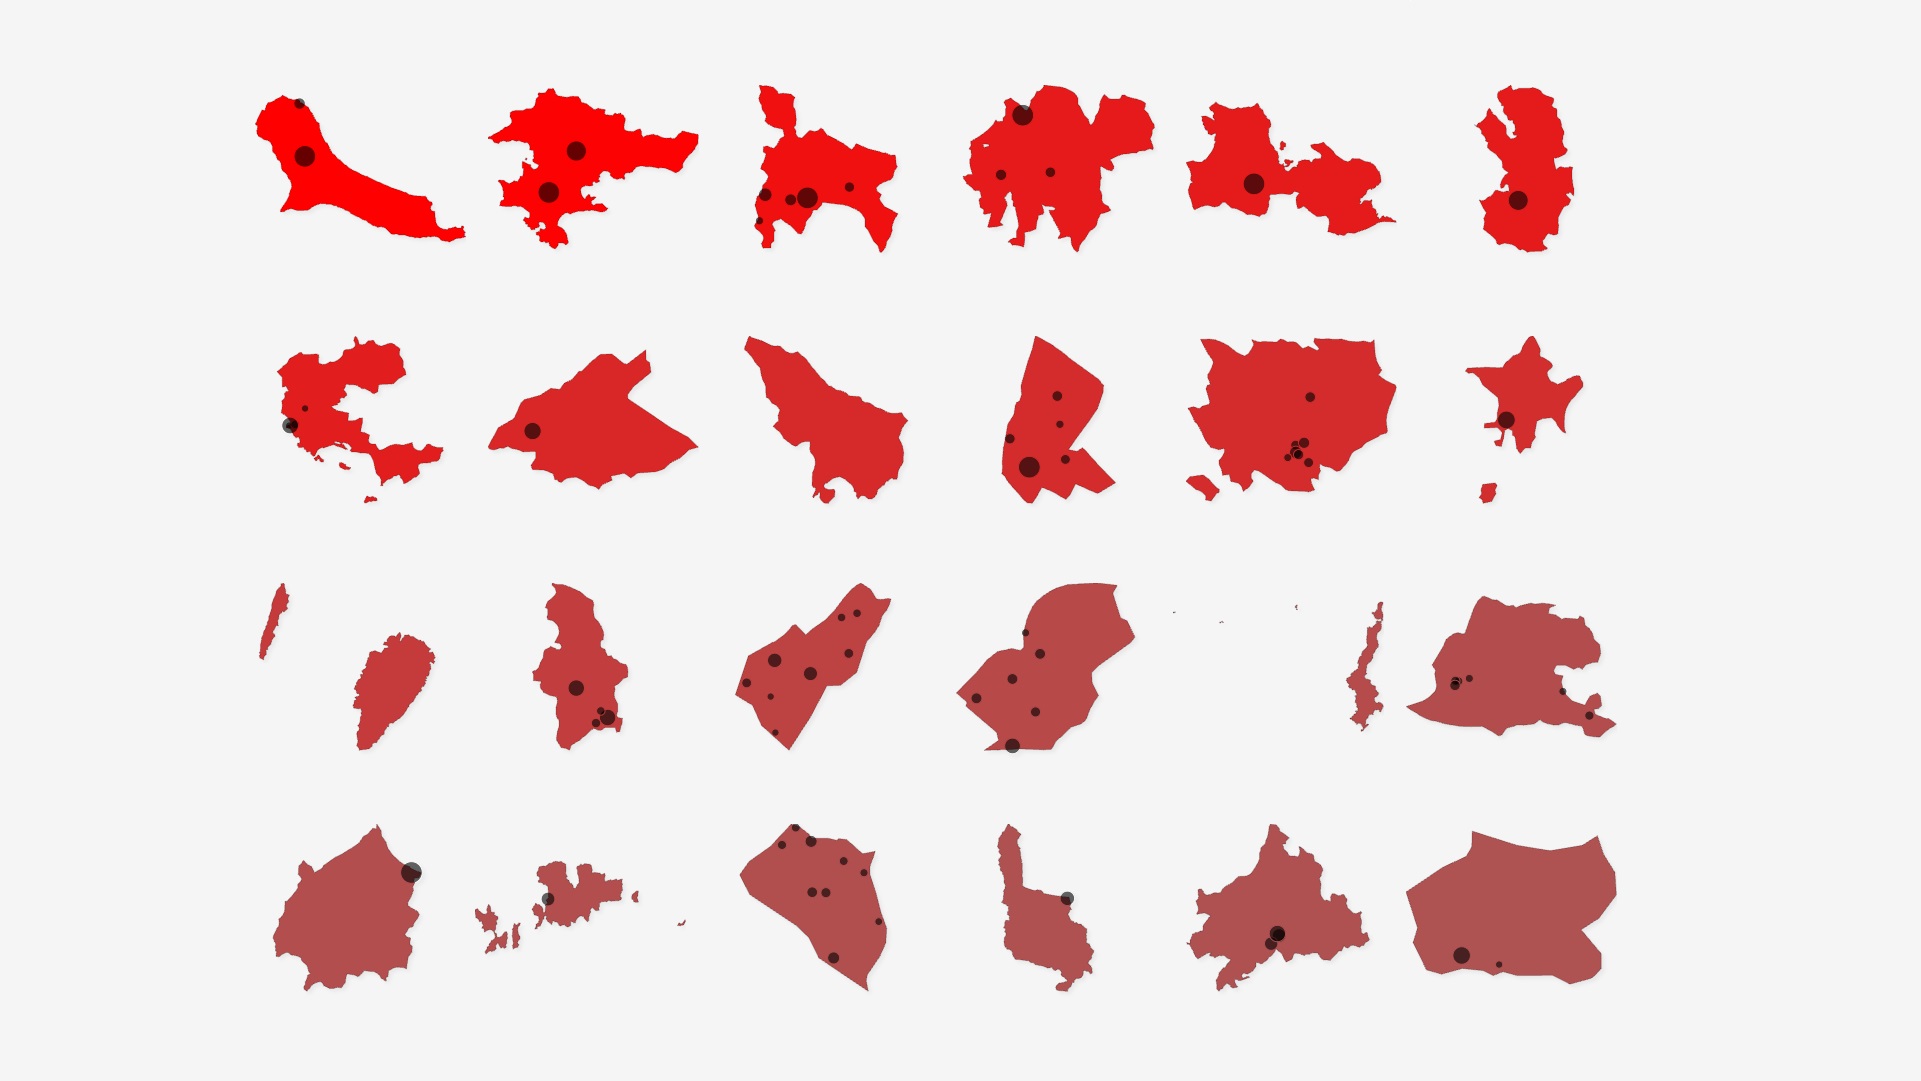
The graph “Auctioned homes by municipality” focuses on completed auctions known to relate to residences and which have been auctioned from January 1, 2018 onwards. The analysis puts a focus on the ratio of houses that are deemed to have been auctioned in each municipality out of all houses located in the municipality. Namely, it is the result of the following calculation for each municipality:
(houses auctioned in the municipality / normal houses existing in the municipality) * 100
The data about the houses located in the municipality derive from the 2011 Population – Housing Census and are based on information about the number of normal residences by municipality published by the Hellenic Statistical Authority. In order to create visualizations, geospatial data from geodata.gov.gr (Base Layers/Administrative Boundaries/Municipality Boundaries) have been used. The strongest red the color of the municipality is, the more auctions of houses appear to have been completed there proportionally. The whiter the color of the municipality tends to be, the fewer the completed auctions of houses within the boundaries of the municipality are estimated to be. In respect of the municipalities of Ikaria, Milos, Limnos, Oinousses, Folegandros, Leipsoi, Tilos and Kantano – Selino, the result of the analysis is possibly affected by the fact that the data about normal residences also include the number of normal residences in the following municipalities respectively: Fournoi, Kimolos, Ai Stratis, Psara, Anafi and Sikinos, Agathonisi, Chalki and Kastelorizo, Gavdos for reasons of statistical confidentiality by the Hellenic Statistical Authority.
The black circles within the municipalities indicate the number of auctioned houses; the iMEdD Lab managed to geolocate them in specific areas within the boundaries of the municipality concerned. This specific visualization therefore is not in line with all the assessed auctions of houses and may, under circumstances, be treated as only indicative: houses that have been auctioned and geolocated form “clusters” that may illustrate indicatively the accumulation of auctions in specific regions within the boundaries of the municipality concerned. These “clusters” are named after the region where their approximate location is – according to the known name of the region nearest to their coordinates. Where “clusters” of geolocated properties are close to the boundaries of the municipality, the name of the region (visible to users when “hovering” the mouse over the black circle) may be wrong.
The application was built with JavaScript and charts were created using D3.js .
1 Offshore special purpose vehicles are companies registered outside Greece and the object of which is to acquire claims and their securitization; namely a procedure where a lender (i.e. a bank) converts claims resulting from loans and credits into securities to sell to investors. In a securitization, the bank’s claims are transferred by way of sale to a special purpose vehicle.
2 Credit servicing firms are licensed companies registered in Greece, associated with special purpose vehicles that entrust to them the management of debts transferred (i.e. from banks).
If you have found any error in the app, you can contact iMEdD Lab at [email protected] or by using the iMEdD’s contact form.
Investigation-Analysis: Kelly Kiki, Thanasis Troboukis
Development: Dimitris Papaevagelou (CVCIO)
Translations: Tina Katoufa
Project Management: Kelly Kiki

