How was the map with the educational units that are closed down due to coronavirus cases created and which is the procedure of processing and analyzing the data.
Suspension of operations in schools due to COVID-19
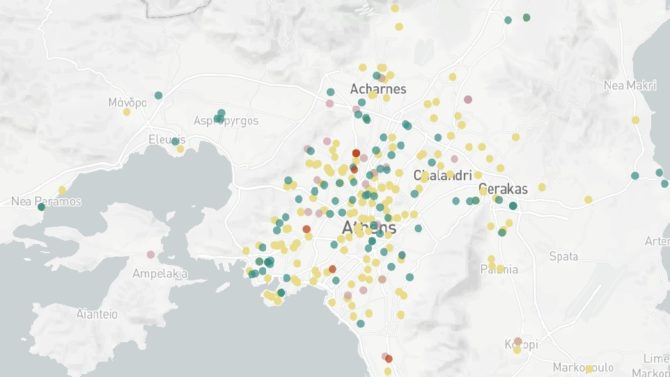
Τα σχολεία που βρίσκονται σε αναστολή λειτουργίας ανά την Ελλάδα, λόγω COVID-19
Methodology for the geolocation of fires
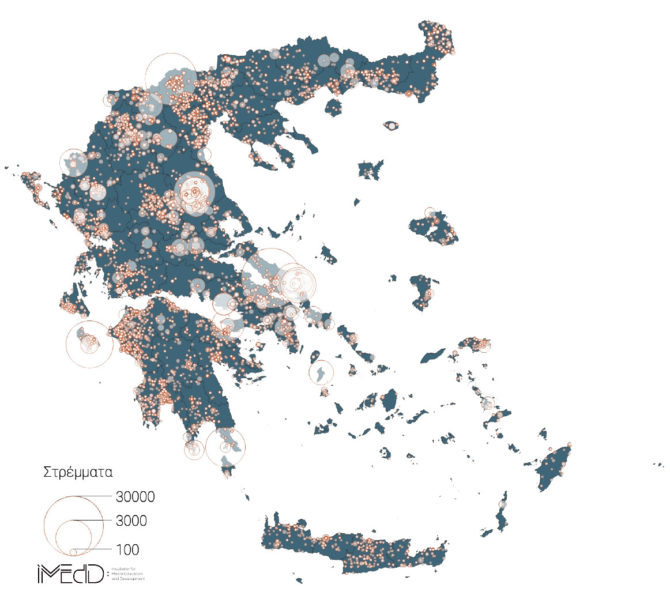
Πώς κάναμε τη χαρτογράφηση των 9500 πυρκαγιών της πυροσβεστικής υπηρεσίας.
ZERO_DAYS = pd.to_timedelta('0 days')

df3['latest_update'] = df3['retrieval_date']

edit_and_keep = []
keep_both = []
keep_last = []

for i,item in df3.iterrows():
    # if school status does not change
    if item['temp_notes_diff'] == float(0):
        # if duplicates have been retrieved on the same date
        if item['retrieval_diff'] == ZERO_DAYS:
            # if suspension time period is the same
            if item['closed_from_diff'] == ZERO_DAYS and item['closed_to_diff'] == ZERO_DAYS:
                keep_both.append(item['school'])

            # if closed from date is the same, but closed to date is earlier in the most recent retrieval
            elif item['closed_from_diff'] == ZERO_DAYS and item['closed_to_diff'] < ZERO_DAYS:
                df3.at[i, 'closed_to_date'] = item['closed_to_date'] - item['closed_to_diff']
                keep_last.append(item['school'])

            # if closed from date is the same, but the closed to date recently retrieved is later or the same
            elif item['closed_from_diff'] == ZERO_DAYS and item['closed_to_diff'] >= ZERO_DAYS:
                df3.at[i, 'closed_to_date'] = item['closed_to_date'] + item['closed_to_diff']
                keep_last.append(item['school'])

            elif item['closed_from_diff'] < ZERO_DAYS and item['closed_to_diff'] < ZERO_DAYS:
                keep_last.append(item['school'])

        # if duplicates have not been retrieved on the same date
        if item['retrieval_diff'] != ZERO_DAYS:
            if (item['closed_to_date'] - item['closed_to_diff']) <= item['closed_to_date'] and\
            (item['closed_to_date'] - item['closed_to_diff']) >= item['closed_from']:
                df3.at[i, 'closed_from'] = item['closed_from'] - item['closed_from_diff']
                df3.at[i, 'retrieval_date'] = item['retrieval_date'] - item['retrieval_diff']
                keep_last.append(item['school'])

            elif (item['closed_to_date'] - item['closed_to_diff']) > item['closed_to_date'] and\
            (item['closed_from'] - item['closed_from_diff']) < item['closed_from']:
                df3.at[i, 'closed_from'] = item['closed_from'] - item['closed_from_diff']
                df3.at[i, 'retrieval_date'] = item['retrieval_date'] - item['retrieval_diff']
                df3.at[i, 'closed_to_date'] = item['closed_to_date'] - item['closed_to_diff']
                keep_last.append(item['school'])

            else:
keep_both.append(item['school'])The mapping and analysis of units that have suspended their operations due to COVID-19 cases is based on data originally acquired from the Ministry of Education and Religious Affairs: specifically, from the beginning of the school year onwards, the Ministry has been publishing suspension of operations announcements (here until the first week of November and, from then on, here), each of which contains the following information:
- reference school
- school code
- school address
- municipality to which the unit belongs
- date until which the operation of the reference school is suspended
- comments on the suspension status (blank in the case of complete suspension, reference to specific classes or grades in the case of partial suspension)
From September 27, 2020 onwards, the iMEdD Lab has been collecting the new suspension of operations announcements in this list on a daily basis and with the use of the programming language Python, it has been enriching the data in the following ways:
- it locates its geographic coordinates. For the purpose of geolocation, a program has been created, with the use of the Requests library: the program asks from the Geocoding API of the Google Maps platform to return the latitude and longitude of each item described as School, Address, Municipality. Google’s response, among other things, contains the geographic coordinates and the corresponding formatted address (as synthesized by Google, based on the information provided).
- it renders a start date for the suspension by setting the retrieval date as such (unless the start date is provided in the collected announcement)
- it defines the suspension status of the school: if there are no comments for the respective unit, then the status is “Complete suspension”. Otherwise, if the comments section mentions specific classes or grades that have suspended their operations, then the suspension status is set to “Partial suspension”.
- subsequently it can update the status that was originally assigned: for example, an initial “Complete suspension” can later be modified to “School reopening”, when the suspension period is over.
- it records the date when the latest status has been rendered and the date of retrieval of the respective announcement
This way, a dataset has been created and maintained, which is open and freely available on GitHub and which, as of today, December 5, 2020, contains 2,238 announcements of suspension of operations.
The above process is repeated on a daily basis and the map, which has been created using the open source Plotly Python library, is updated with the latest data each time.
The retrospective analysis of data per day
For the purposes of retrospective analysis of the data and the diagrammatic presentation of suspensions over time, the data have been cleansed and processed –also by using the programming language Python.
Specifically, the following problem was identified and resolved: the 2,238 announcements of suspension of operations in the above dataset correspond to 1,675 unique educational units. This means that more than one announcements of suspension of operations was made for 563 units, for various reasons. For example, a partial suspension may have been originally scheduled for a school and then, before this was completed, it may have been announced that the school was completely suspending its operations. In other cases, a school’s originally scheduled suspension period may have been revised in a subsequent announcement. Often, the operation of a class is suspended and, later, more classes of the same school also suspend their operation –then, the ministry publishes a new announcement for the same school.
Therefore, when we wanted to retrospectively study the progress of schools that have suspended their operations over time, we needed to “cleanse” our data, so as to avoid to count schools twice or more times on the same day. Therefore, a program was developed which, for each school that exists in the dataset twice:
- checks if there is a chronological overlap between the announced suspensions of operations
- integrates the suspension period, if there is no change in the suspension status or
- adjusts the suspension intervals, in case a change in status is detected in the meantime, so that there are no double entries
For example, assuming that we have the following two announcements for School A:
- School A, Class E1, 1/10-14/10
- School A, Class E2, 3/10-17/10
Then, after cleansing and processing the data, we will have:
- School A, Partial suspension, 1/10-17/10
However, assuming that we have the following two announcements for School B:
- School B, Class A2 and Class B1, 1/10-14/10
- School B (no comments), 4/10-18/10
Then, after cleansing and processing the data, we will have:
- School B, Partial suspension, 1/10-3/10
- School B, Complete suspension, 4/10-18/10
194 schools were identified, for each of which there were more than three collected announcements of suspension of operations, with overlapping time intervals, for various reasons. These were examined separately and the corresponding necessary adjustments were made manually, using spreadsheets.
Finally, a program was developed, again using the programming language Python, which:
- classified the educational units by level of education
- retrospectively reported the status of each unit for which an announcement of suspension had been collected, for each day during the study period, from September 27, 2020 to December 5, 2020
The result is a second, processed, data set that is also available on GitHub.
Translation: Evita Lykou