
Data on fires – including the 2019 wildfires – was obtained from annual reports published by the fire agency. Maps were generated automatically through the use of Google’s Geocoding service and Python programming language.
The dataset from the fire agency’s open data website contains 9,500 rows and 32 columns. This is a fairly complete set that includes information on the date, time, and area of each fire incident as well as data regarding the type of area burned and the forces required to extinguish it.
In order to be able to display each fire on the map, we had to locate its geographical coordinates, i.e. the longitude and latitude of each recorded incident.
Latitude is a measure of the position of a point on the earth’s surface in terms of degrees north or south of the equator. Longitude is the angle between the meridian plane passing through the ground and the meridian plane passing through the first meridian.
For example, the coordinates for Syntagma Square, Athens are: 37.9755° N. (Latitude), 23.7349 ° E. (Longitude)
To locate the geographical coordinates we created a program using the Python programming language, which “read” data on Prefecture, Municipality, Area and Address of each fire recorded by the fire agency and subsequently sent a geocoding request based on this information to Google’s Geolocation Service. The request was created using Python’s Requests Library.
Google’s response to each request included, among other things, the longitude (lat) and latitude (lng) based on our request, as well as information on how accurate the geolocation (loc_type) is. Specifically:
• “ROOFTOP” indicates that the returned result is an exact geocode, for which we have location information accurate down to street address precision.
•“RANGE_INTERPOLATED” indicates that the returned result reflects an approximation interpolated between two precise points (such as intersections). These types of results are usually returned when rooftop geocodes are unavailable for street addresses.
• “GEOMETRIC_CENTER” indicates that the returned result is the geometric center of a result. For example, in a fire at Papagou Cemetery, the returned result will be the center of the cemetery.
• “APPROXIMATE” the search result is approximate.
The geolocation program
Οι δασικές πυρκαγιές του 2019

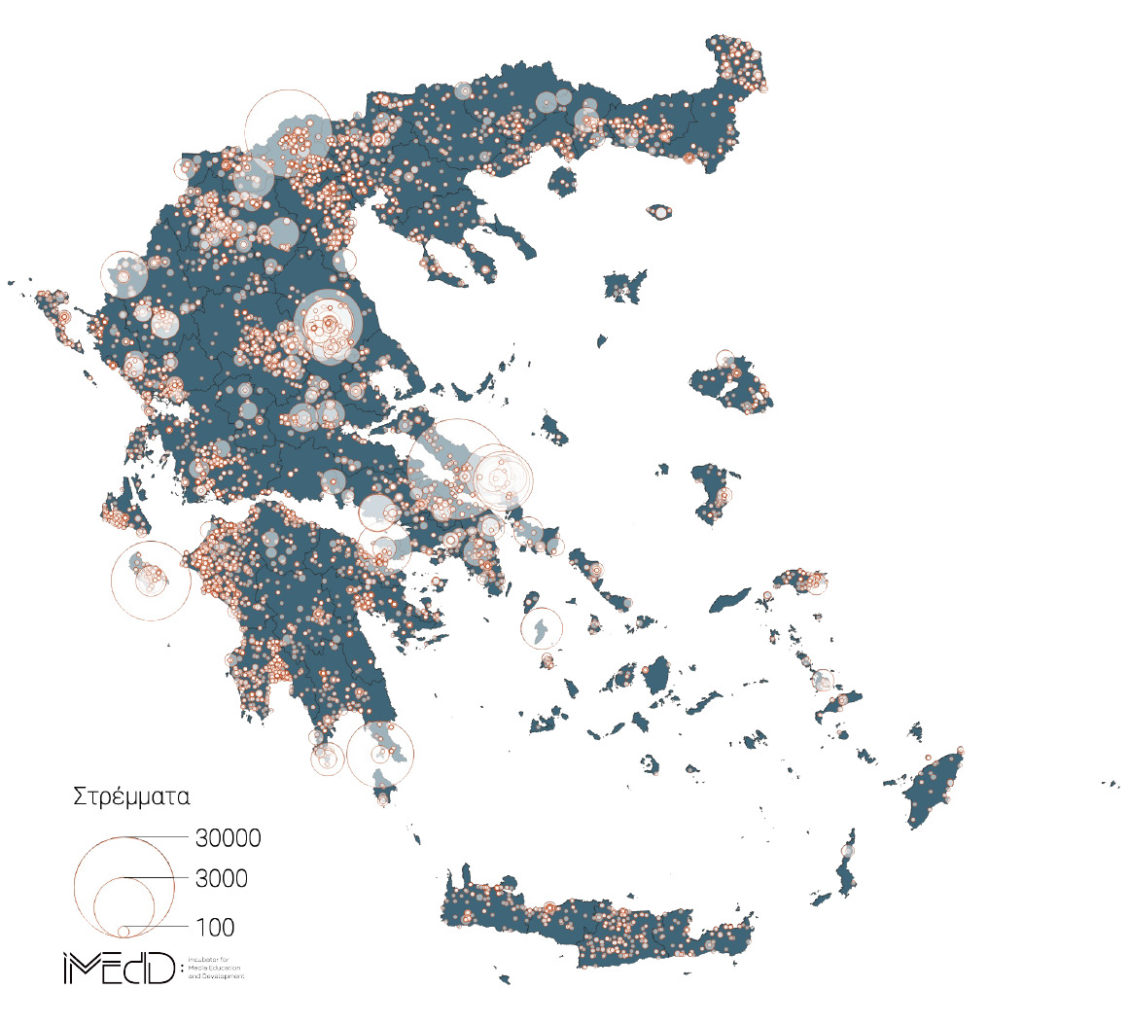
Ανάλυση 9500 πυρκαγιών σε ολόκληρη την Ελλάδα.
Βάση δεδομένων με τις πυρκαγιές του 2019 στην Ελλάδα
Οι δασικές πυρκαγιές που κατέγραψε την περασμένη χρονιά η πυροσβεστική υπηρεσία με προσθήκη του γεωγραφικού μήκους και πλάτους ανά συμβάν.
1 2 3 4 5 6 7 8 9 10 11 12 13 14 15 16 17 18 19 20 21 22 23 24 25 26 27 28 29 30 31# You need to create an account to Google Develpers # Console in order to get an API key and use the # geolocation service import pandas as pd import requests import numpy as np # In "XXX" put your API key. api_key='XXX' # We read the excel file. df = pd.read_excel('Dasikes_Pyrkagies_2019_v1.5.xls', header=1) for i, item in df.iterrows(): # The search_str variable contains the information that will be geolocated. search_str = f"{item['Νομός']} {item['Δήμος']} {item['Περιοχή']} {item['Διεύθυνση']}" geocode_url = "https://maps.googleapis.com/maps/api/geocode/json?address={}".format(search_str.lower())+'&key='+api_key results = requests.get(geocode_url) # The result is a json. res=results.json() # We save the results to our dataframe df.at[i, 'lat'] = res['results'][0]['geometry']['location']['lat'] df.at[i, 'lng'] = res['results'][0]['geometry']['location']['lng'] df.at[i, 'loc_type'] = res['results'][0]['geometry']['location_type']
The static fire map was created using the QGIS mapping software.
The charts and the interactive map were developed using the Plotly library and javascript D3 library.

