Food insecurity is increasing as a result of historically high food inflation, export restrictions and the dependence of many countries on basic foodstuff imports from Ukraine and Russia. What do the data suggest about the global imports and exports of foodstuffs and fertilizers.
Global food prices still hit 60-year record high in 2022
Global food prices in 2022 still hit a record high since 1961, according to the UN Food and Agriculture Organization’s (FAO) latest food price index
As the war in Ukraine is still ongoing, insecurity at world level about the probability of a global food crisis has worsened. The historically high prices of basic food items globally, the increased cost of energy affecting the escalation in their prices, the dependence at international level of many countries on imports from Ukraine and Russia for the supply of food commodities, the tons of grain blocked at Black Sea ports and the countries’ restrictive trade practices against food supply disruptions are threatening food security globally – and in particular of the economically poorest countries in the world.
Nonetheless, even before the war, the global food trade was not at its best. The COVID-related supply chain disruptions were too recent and therefore, food prices were already high. “This is not a new crisis. The number of people facing severe food insecurity has grown dramatically in the last six years. The Ukraine war is the latest element in an extremely complex situation”, Luca Russo – the FAO’s (Food and Agriculture Organization of the United Nations) lead analyst for food crises – told Al Jazeera on June 3rd 2022. However for now there is no food shortage, but prices are escalating, as Russo noted during the same interview – “the increased price in wheat and fuel means that with the same money we can deliver much less assistance”, he explained.
An analysis of the data on global imports and exports of foodstuff in 2020 publicly available on resourcetrade.earth developed by Chatham House, reveals that Ukraine and Russia are among the world’s largest exporters of cereal crops and oils, with their cumulative share of tons exported globally reaching 19% and 7% respectively. It is perhaps indicative that cereal and vegetable oil price indices increased by 30% and 31% respectively in May 2022 compared to same month last year, as can be seen from the analysis of the most recent data on the World Food Price Index released by FAO on June 3rd 2022. Yet, while the Food Price Index dropped 0,6% mom in May of 2022, cereal prices continued to rise and the cereal price index jumped 2,2% in May 2022 compared to April 2022.
Meanwhile, Ukraine and Russia are among the top ten exporters of honey and sugar respectively, while Russia is the largest global exporter of fertilizers.
As regards cereals exports specifically per product, the combined world export share of Ukraine and Russia accounts for 32% of buckwheat, while it accounts for 28% of millet, 27% of wheat, and 19% of corn. At the same time, sunflower oil exports (including sunflower seeds and derived products) from Ukraine (35%) and Russia (19%) account for 55 percent of the global supply.
At the same time, many developing countries appear to be heavily dependent on imports from Ukraine and Russia, as observed when the estimated percentage of cereals, oilseeds and fertilizer imports from Ukraine and Russia together is compared against the overall respective imports in each country according to World Bank figures on GDP per capita by country for 2020.
Looking at the same figures, we see that the 20 poorest countries in the world import approximately 36% of wheat from Ukraine and Russia. Including, for instance, Rwanda, Malawi, Sudan, Tongo, Uganda, Somalia, and Ethiopia with the percentages of imported wheat from both countries averaging 91%, 71%, 59%, 49%, 45%, 29% and 18% respectively.
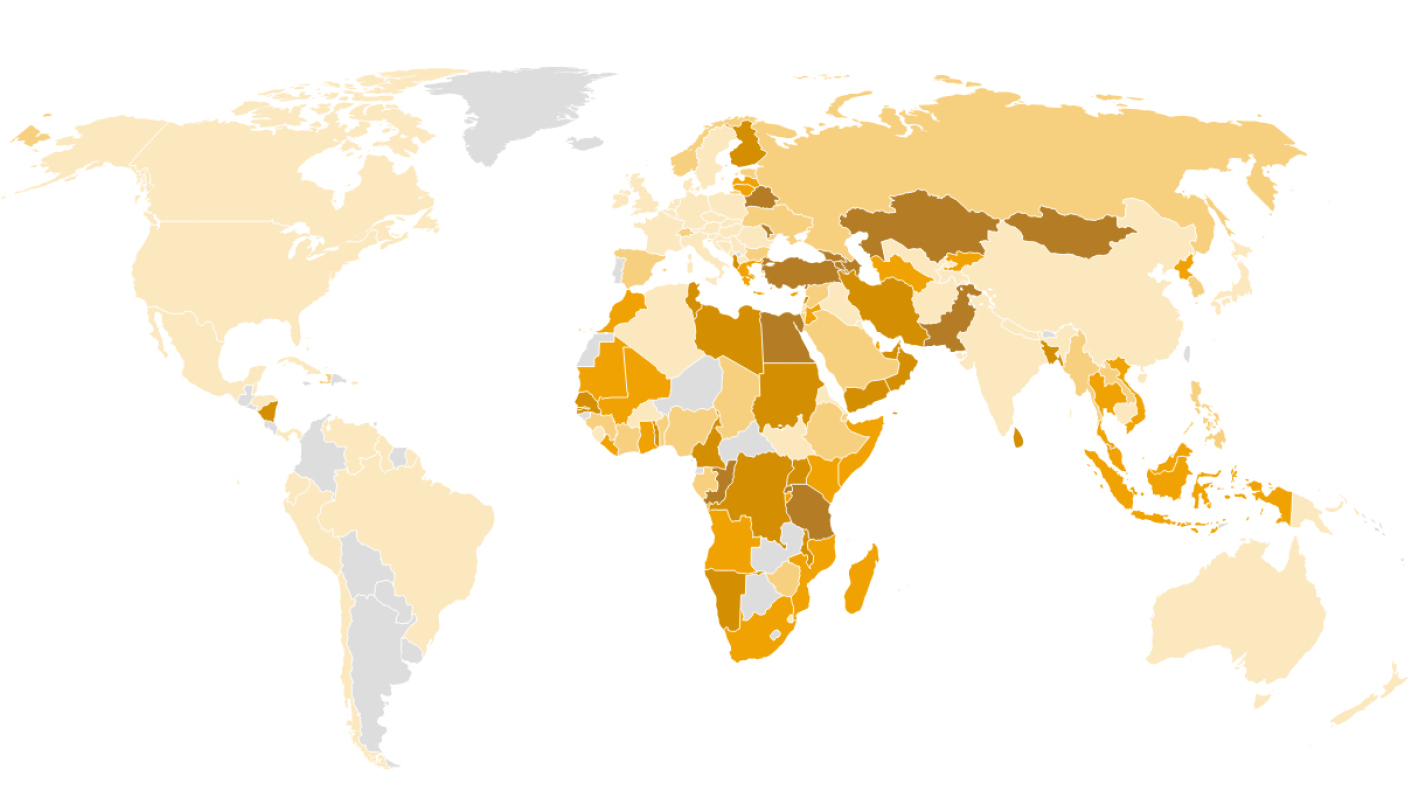
The following map reflects each country’s dependence on imports from Ukraine and Russia for the supply of wheat, sunflower oil and fertilizers (as a percentage of total imported quantities of each product per country). The darker the colour, the greater dependence on imports of each country from Ukraine and Russia together is.
However, by grouping together data by region, it appears that Northern Africa and Western Asia imports nearly 55% of their wheat from Ukraine and Russia, Central and Southern Asia 37%, Sub-Saharan Africa 28% and Eastern & Southeastern Asia (excluding China) 20%.
Each country’s dependence on wheat and sunflower oil imports from Ukraine and Russia is also indicated in the following table: the darker the color of each field, the greater each country’s dependence on imports from Ukraine, Russia or both countries together is. At the same time, the quantity per capita of imported wheat and sunflower oil from both countries in 2020 is also reflected. For instance, in Lebanon - being the top importer of wheat per capita per year (112 kilos in 2020) from Ukraine (corresponding to 52% of wheat imports in the country) – food inflation is now among the highest in the world, with food prices rising by 3.000 percentage points, compared to 2020, according to a Reuters Graphics’ article, based on Refinitiv’s data.
The Reuters’ article also highlights the issue of further international pressure, due to the restrictions on food exports imposed by over 20 countries around the world, in response to the impact of the war in Ukraine. On this issue, detailed information has been published by Joseph Glauber, David Laborde and Abdullah Mamun, research fellows with the International Food Policy Research Institute (IFPRI) in their post: “From bad to worse: How Russia – Ukraine war-related export restrictions exacerbate global food insecurity”. As they wrote in April 2022, “As food price inflation grows around the world, and no quick resolution to the Ukraine war in sight, past experience suggests that more countries will impose restrictions. This could further boost prices and increase price volatility. Previous research on the impacts of export restrictions during 2007 – 2008 food price crisis suggests that such policies contributed to 40% of the increase in agricultural prices over the period”.
Methodological Information
All the analyses presented and involving imports and exports of products are based on annual data for 2020 publicly available for retrieval on resourcetrade.earth developed by Chatham House. The latest data primarily originate from the United Nations International Trade Statistics Database (UN Comtrade) and detailed information can be found here. Moreover, annual data have been used for 2019 from the same source only for map data visualization purposes, for the cases of a few countries about which data for 2020 were missing. Unless otherwise indicated, country-specific analyses regarding imports by product and its dependence on imports from Ukraine and Russia are based on calculated percentages of imported quantities of each product from both countries in relation to overall imported quantities of the same product in the country concerned. Analyses/ visualizations including GDP figures are based on World Bank open data for 2020. The Pandas Python Library was used for the data analysis purposes in this piece, and data visualizations have been created in Datawrapper.
Additional reporting: Stefania Ibrishimova
Translation: Tina Katoufa
This piece is part of the iMEdD’s Observatory on Ukraine, which can be found here. The present text and graphs are governed by the Creative Commons license (CC BY-NC 4.0) and are freely available to any interested party, provided they are not intended for commercial use: you may reproduce and/or incorporate them into your webpage, including a reference to their creator and their source: Kelly Kiki, Stefania Ibrishimova, “The poorest countries around the world are also highly dependent on wheat imports from Ukraine and Russia”, iMEdD, June 7, 2022, CC BY-NC 4.0.