
In order to assess the 2020 excess mortality in Greece, we used official data on weekly deaths published by the Hellenic Statistical Authority (ELSTAT).
Mortality rate refers to the number of deaths per unit of population, such as the population of a country. The fatality rate is the proportion of people who die from a specified disease among all individuals diagnosed with the disease.
A conversation with one of the “founding fathers” of Artificial Intelligence

A few months before Yoshua Bengio’s participation in the SNF Nostos Conference on August 26 and 27, 2021, on “Humanity and Artificial Intelligence,” we discussed with him the future of “intelligent” computer systems, the effort to teach AI some common sense, and the possibilities and challenges of using such technologies.
Excess mortality is defined as the actual recorded number of deaths regardless of cause, minus the statistically expected ones. For example, if we assume that 100 deaths had been recorded in a given country during the 40th week of 2020 – as opposed to the previous five year period (2015-2019), during which an average of 80 deaths had been recorded in the same week – we would say that the 40th week of 2020 saw a 25% increase in fatalities compared to the number of statistically expected deaths (excess mortality).
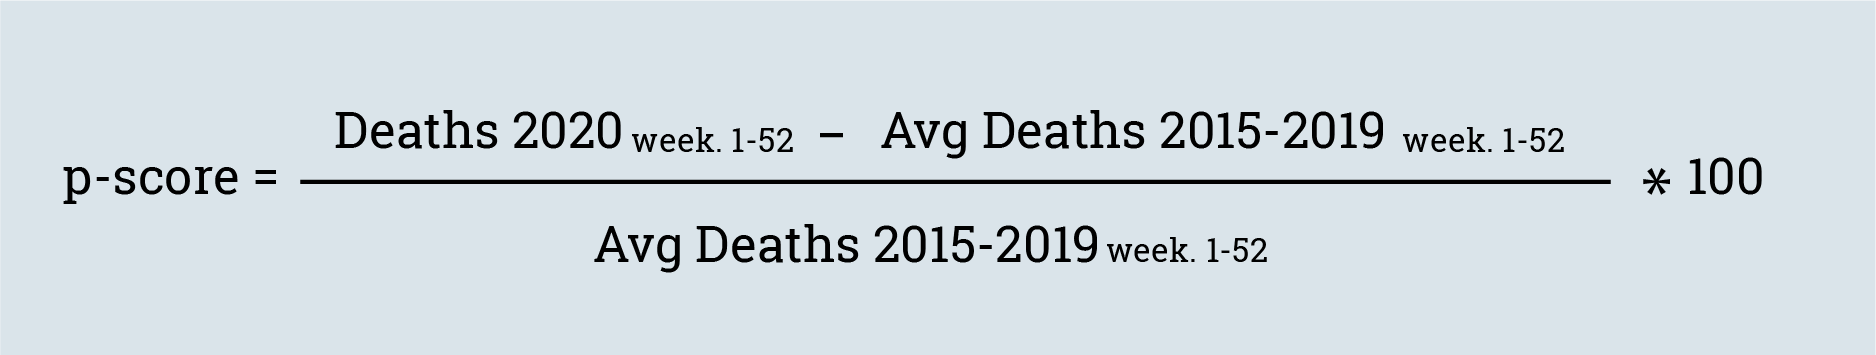
To estimate the statistically expected deaths for 2020, we calculated the average weekly deaths that occurred between 2015 and 2019 and subsequently determined the p-score, i.e. we subtracted the recorded number of deaths from the estimated ones for 2020 and divided the difference by the estimated deaths. We then went on to multiply the quotient by 100 to get a percentage number. You can find out more about calculating the p-score in the Our World in Data article.
Creating a dataset compiled from parliamentary minutes from the last 31 years

How we compiled a single dataset containing speeches given in the Greek Parliament plenary sessions between 1989 and 2020, as well as data on the MPs who addressed them.
This analysis provides an overview of excess mortality. However, it should be noted that no data corrections based on trends in population size change, aging, and mortality were made. If, for instance, an increasing trend is observed in a country’s mortality, the five-year average will overestimate excess deaths. For countries with a decreasing trend in mortality, excess deaths will be underestimated.
In our analysis for excess mortality last February, we estimated what proportion of excess deaths corresponded to confirmed deaths associated with COVID-19 based on EODY’s daily reports on deaths, which we obtained via iMEdD’s open API.
Sample request using Python (via the iMEdD Lab API)
import requests
import pandas as pd

url = 'https://covid.imedd.org/global/grc/all/2020-10-12/2020-12-06/'
data = requests.get(url).json()

df = pd.DataFrame(data)
EODY announces the number of daily deaths based on the date they were reported to them. However, this number does not correspond to the daily number of laboratory-confirmed COVID-19 deaths. Therefore, in this analysis, we used data on laboratory-confirmed deaths drawn from the corresponding graph in EODY’s daily report. This difference affects our analysis by three percentage points. That is, of the approximately 8300 statistically unexpected deaths, 58% are confirmed COVID-19 cases based on EODY’s reports, whereas, based on laboratory-confirmed COVID-19 deaths, this figure rises to 61%.
To calculate “excess mortality” by administrative region, we used data from two iMEdD Lab exclusive stories on deaths by region, published last December and last February respectively. Using the number of deaths that had occurred by 10 December and 18 January as a reference point, as well as the total number of deaths that had occurred by 31 December in the country, we made an estimate of the number of deaths that took place per regional unit until December 31st. Based on this estimate, we calculated “excess mortality” by region.
Our overall calculation of the median age of patients who died in and outside the ICU was based on the median age of people who would die per week. Due to a lack of disaggregated data by the deceased patients, we chose to calculate the median ages.

