

The diplomat, the chameleon, the bloodhound: Understanding newsroom personalities

How do you run a newsroom full of people whose job is to question authority?
Decades of climate records with a few lines of code: Analyzing Copernicus data
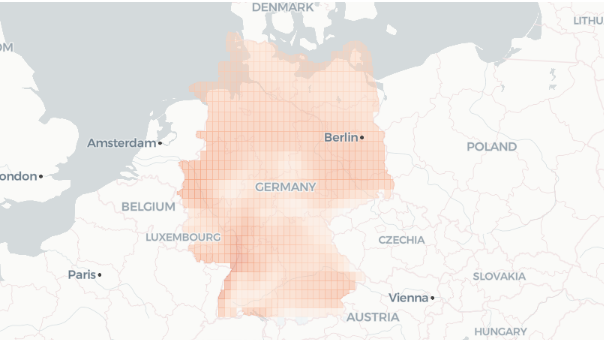
Climate data often come up in the newscycle during major weather events. Copernicus data can be analyzed using a few lines of Python code, without installing software or downloading files to your computer.
Media Hat: Re-Capped

Every month we pull together tools, research, and ideas for journalists wearing… many hats.
How close is the nearest school? Mapping distances across Greece

How far away is the nearest school? We used secondary schools across rural Greece as a case study to map distances to an essential service and demonstrate how isodistances can be calculated and visualized on a map.
Opening the “black box” with explainable AI – a conversation with Menna El-Assady

With artificial intelligence tools having overwhelmed work routines and even our daily lives, Menna El-Assady, computer science professor and head of the Interactive Visualization & Intelligence Augmentation Lab of ETH Zurich, explains what we should avoid, what are the real questions and how we can understand what really happens inside AI models.
Journalism-First Tools to Search Spreadsheet Text, Track Website Changes, and Mine Investigative Resources Through the Years

Three new, powerful and easy-to-use investigative tools from NICAR26.
Retrieving and processing OpenStreetMap data
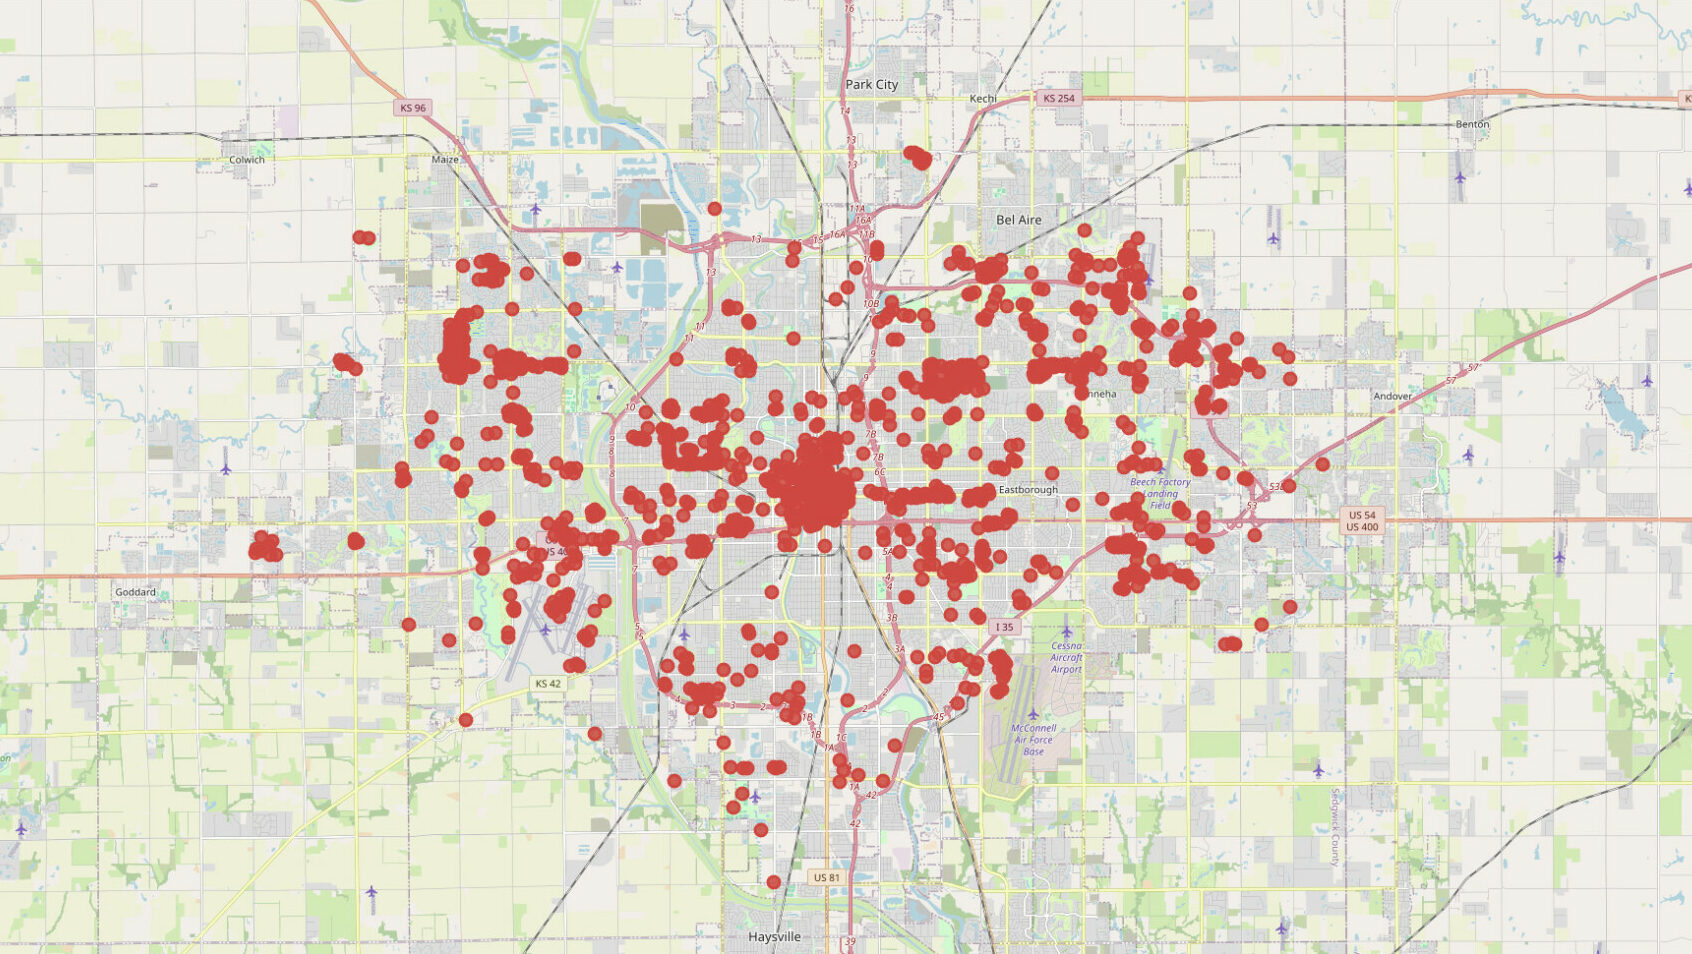
OpenStreetMap (OSM) data is a "treasure trove" hiding in plain sight for any journalistic mapping project. We present how one can retrieve and process OpenStreetMap data using Python or QGIS.
How to get “live” data in Google Sheets for free and with just a few lines of code




ALSO VISIT


