
The iMEdD Lab’s online application “Auctions in Greece since 2018” was published in October 2021 and since then it is updated with the latest data once a month. The application was created for the purpose of informing any interested party of the evolution of auctions in our country, where auctions take place exclusively via the online auction service from February 2018 onwards, but also with a view to facilitating the work of journalists and researchers in general. More information on the data, their processing, analyses, and visualizations can be found in the published methodology for the creation of the app.
Filtering options
Four filters are available on the application:
- Status: you can filter results presented in most visualizations by the status of scheduled auctions –select “Completed” to see only auctions that have already taken place or “All” to have the application return results based on all scheduled auctions, including those that are suspended, those that have been cancelled and those that are about to take place.
- Year: in any analyses where this filter is available, you can select a specific year of interest or “All”, if you want the chart to reflect all online auctions studied from 1 January 2018 onwards.
- Hastener Class: in most analyses presented on the app, you can choose to narrow down the results to auctions that have been sped up with “Bank involvement”, i.e. they have been initiated either by the banks themselves or by corporates connected to bank portfolios (such as offshore special purpose vehicles to which claims on bank loans and credits have been transferred). You can also limit the results to auctions that have been initiated by other hasteners than those mentioned above (“Other” option) or select “All” if you want to see all results – irrespective of the hasteners of the auctions.
- Asset Type: in any analyses where this filter is available, you can select “All” if you wish to include all results, or a specific type of property on which you want the analysis to focus. In the second case, the options are: Land, Warehouse, Industrial site, Office, Parking, Store, Residence, Plot, Plot with building, Hotel, Ships, Other movable property, Other business space. The options “Ships” and “Other movable property” are exceptionally not available in this filter, in the map under the heading “Geographical distribution of property auctions”. In the chart “Evolution of auctions over time”, the option “Unknown” is also available in this filter, in case one wishes to see how the scheduled auctions for which the type of property concerned is not known are distributed over time.
Embedding graphs and extracting results
You can integrate each graph or map individually into your own website, based on the filters you choose. To embed any visualization on your page, click on the icon. Then, a window similar to the one above will appear on your screen, in which you define what you want the visualization to be embedded to show. For example, if you want to integrate the “Geographical distribution of property auctions” map on your page, focusing on “Completed” auctions and “Residence”, you need to make the corresponding selections in the “Status” and “Asset Type” menus.
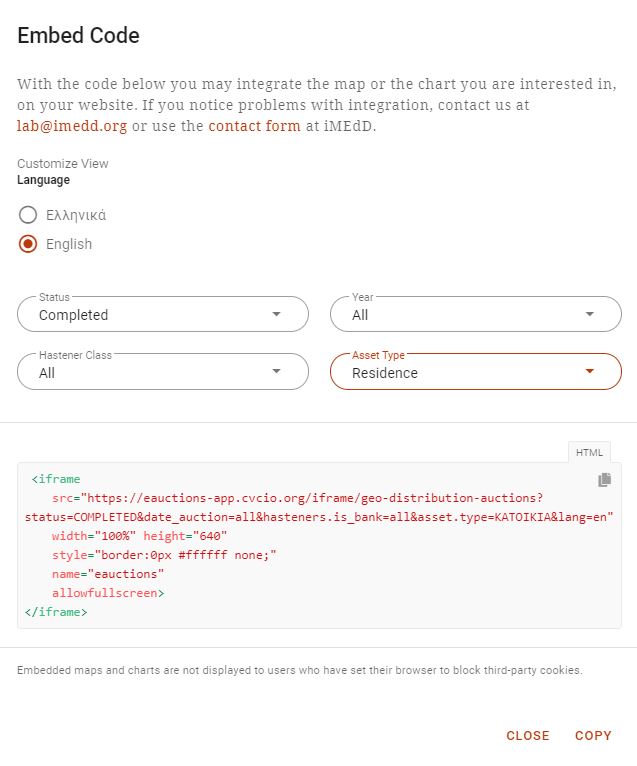
Then, the grey box at the bottom of the window will automatically generate the iframe and the HTML code that you will copy and paste into your content management system. You can adjust the height and/or width parameter so that each visualization will better fit the dimensions of your page once it is embedded there.
Each graph or map also offers the option to export the results you see represented. If you select “Export based on filters applied” from the toolbar at the top right of any visualization, then the results that have been formatted based on any filters you may have applied will be exported to your computer, in a .csv file, which you can import into any spreadsheet software to read and/or further process the results.
If you encounter any problem when integrating the visualizations and need help, you can contact the iMEdD Lab at [email protected] or by using the iMEdD contact form.
For the analysis carried out via the application, the iMEdD Lab was based on publicly available information. The application does not share any kind of demographic or personal information. The material published in the present application is licensed under Creative Commons Attribution Non-Commercial 4.0 (CC BY-NC 4.0). Each time the content of the application is used, the guest/user should make a clear and explicit reference to the creator (iMEdD Lab and iMEdD), the link to the License to Use, and reference as to whether any changes have taken place. It cannot in any way be implied that iMEdD and iMEdD Lab as creators of the application accept your work or the use carried out by the guest/user. In detail, the Terms of Use of the application are available here.

