
2020 saw an increase in excess mortality in Greece, where a mere 43% of excess deaths were confirmed to be associated with COVID-19, raising questions about deaths that were an indirect result of the pandemic and could have possibly been prevented. iMEdD Lab publishes data on the geographical distribution of 5,471 COVID-19-related deaths, according to which Northern Greece exhibits disproportionately high death rates compared to the rest of the country.
Since the onset of the pandemic, more than 5,900 people have lost their lives to COVID-19 in Greece, with 85% of them having been aged 65 years and older. The vast majority of deaths were recorded during the second wave of the pandemic, between early November 2020 and early January 2021.
More specifically, from November 1st to November 30th, the total number of deaths would double approximately every 15 days (635 deaths on November 1st, 1,288 deaths on November 17th, 2,406 deaths on November 30th). By the end of December, the number of deaths had doubled again (4,838 on December 31) and, by the end of January, it had increased by about 20% (5,764 on January 30).
Total Number of Deaths during the Last Three Months
* Mortality rate represents
the number of deaths per unit
of population (e.g. the population of a country).
Fatality rate is the proportion
of people who die from a specified
disease among all individuals
diagnosed with the disease.
Due to the high number of deaths and their sharp increase, within the period 9 November 2020-30 December, the European network EUROMOMO – a mortality* monitoring activity that measures excess deaths from any cause in 27 member states of the European Union (EU) – recorded a substantial and (statistically) unexpected increase in excess mortality in Greece.
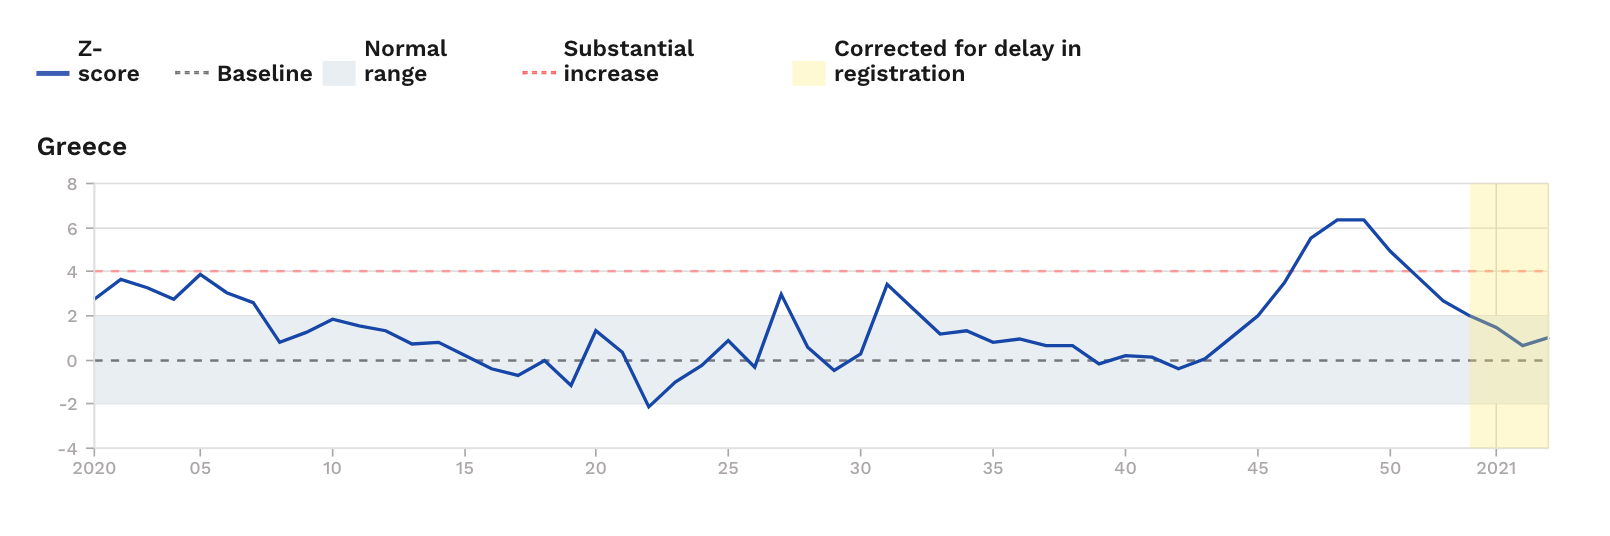
Excess mortality is defined as the actual number of deaths regardless of cause, minus statistically expected deaths. For example, if we assume that 100 deaths had been recorded in a given country during the 40th week of 2020 – as opposed to the previous five years (2015-2019), during which an average of 80 deaths had been recorded in the same week – we would say that the 40th week of 2020 saw a 25% increase in fatalities compared to the number of statistically expected deaths (excess mortality).
Up to 41% more deaths than statistically expected recorded in early December 2020
Excess mortality is considered to be one of the most significant and impartial indicators for monitoring COVID-19-related deaths. This is because, as noted in a study by Janine Aron, Charlie Giattino, John Muellbauer and Hannah Ritchie, published in “Our World in Data” in June 2020, “In a pandemic, deaths rise sharply, but causes are often inaccurately recorded, particularly when reliable tests are not widely available.”
The study points out how excess mortality rate can help us overcome two major problems in reporting COVID-19-related deaths: under-reporting and “collateral damage”.
“Excess mortality data include ‘collateral damage’ from other health conditions, left untreated if the health system is overwhelmed by Covid-19 cases, or by deliberate actions that prioritise patients with Covid-19 over those with other symptoms.”
Janine Aron, Charlie Giattino, John Muellbauer and Hannah Ritchie – Our World in Data
The value of this indicator was also highlighted in an event that was live-streamed on October 5, 2020, which included presentations by Sotiris Tsiodras, Professor of Medicine and Infectious Diseases at the National and Kapodistrian University of Athens (EKPA) and leader of the team charged with managing the coronavirus pandemic in Greece, as well as Gikas Majorkinis, Assistant Professor of Medicine at EKPA and also a member of the aforementioned advisory panel, who, during a briefing addressed to accredited health journalists on October 2, noted “…we are happy to see that Greece has recorded no excess mortality for the time being. This is key for Greece at the moment.”
Indeed, according to official data we obtained from the Hellenic Statistical Authority (ELSTAT) regarding the total number of deaths per week in the country, in early October, excess mortality in Greece stood only at 4%. A few weeks later, however, the situation changed dramatically.
From the 46th to the 49th week of 2020 (November 9 – December 6), an average of 34.49% more deaths than statistically expected were recorded (average deaths that occurred in the respective weeks during the previous five years). Notably, mortality increased by:
- 21% in the 46th week (9/11 – 15/11)
- 35% in the 47th week (16/11 – 22/11)
- 41% in the 48th week (23/11 – 29/11)
- 41% in the 49th week (30/11 – 06/12)
An increase of more than 25% is considered significantly high. Our analysis ends in the 49th week, as ELSTAT has not disclosed any data on the remaining four weeks.
Recorded deaths per week in absolute numbers
Χάρτης ECDC: Γιατί δεν ξέρουμε εάν οι πράσινες περιοχές είναι «πράσινες»
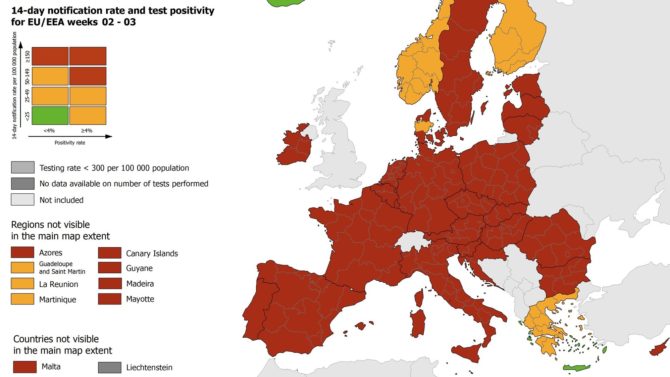
Εξηγούμε βήμα-βήμα πώς διαβάζεται ο χάρτης του ECDC και για ποιους λόγους, ακόμη και αν τα αποτυπωμένα ως πράσινα νησιά της Ελλάδας είναι όντως «πράσινα», δεν το γνωρίζουμε.
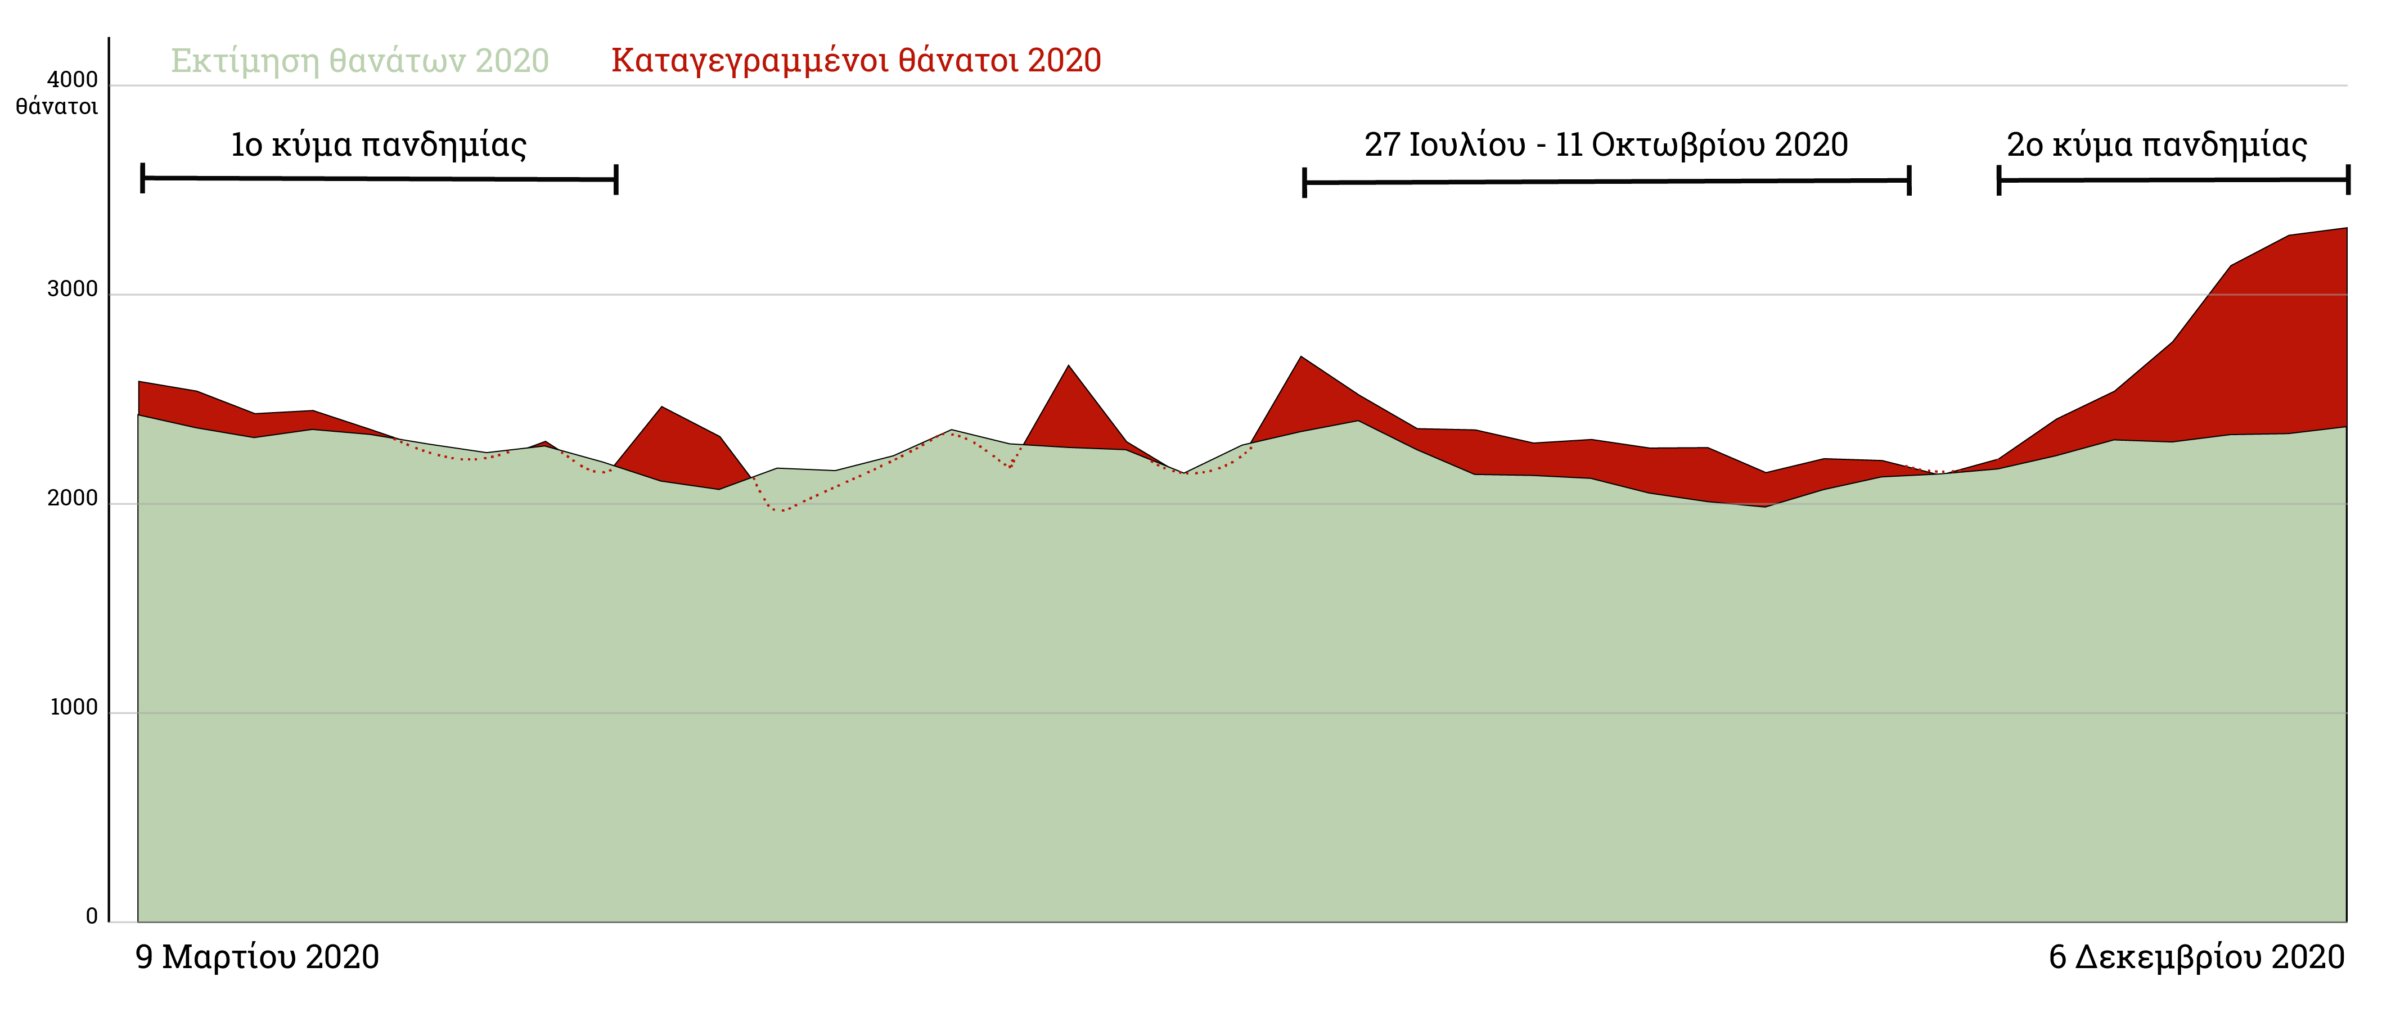
Only 43.54% of excess deaths are associated with COVID-19
Looking at the period between the first COVID-19-related death on the 11th week of 2020 (on March 11, 2020) and the 49th week (which ended on December 6, 2020), we observe that the death toll rose by 7.93%, compared to the statistically expected number of deaths. Based on the previous five-year average (2015–2019), this number is estimated at 86,976 for 2020. Absolute numbers in this analysis should be interpreted with caution as they are an estimate – they are not derived from official mortality data. However, it is commonly accepted practice worldwide that excess mortality is calculated based on the average death rate of the previous five years. The number of recorded deaths for the same period of 2020 was 93,863. By subtracting the expected number of deaths from the observed number of deaths, excess deaths are calculated at 6.896.
The first hypothesis we explored was whether these approximately 6,800 deaths were associated with COVID-19. According to iMEdD Lab, as of Sunday, December 6, the total number of confirmed COVID-19-related deaths in the country was 3,003 (which only accounts for 43.5% of statistically unexpected deaths or excess deaths.)
Ποιο είναι το πραγματικό κόστος της πανδημίας σε ανθρώπινες ζωές;
Διαδραστικός χάρτης με την πορεία του εμβολιασμού για την COVID-19 στην Ελλάδα
Ενημέρωση σε πραγματικό χρόνο για την πορεία των εμβολιασμών στην επικράτεια.
The above analysis suggests that either some COVID-19-related deaths were not classified as such, resulting in an underreporting of COVID-19 deaths in the National Public Health Organization’s(EODY) official announcements, or that there is an increased fatality rate due to seemingly non-COVID-related diseases (whereby a patients’ prognosis is directly or indirectly affected by the pandemic). For example, it has been observed that in some countries patients avoid hospital visits for sudden or chronic conditions, such as cancer, heart attacks or strokes, for fear of contracting the coronavirus; or in other cases, the overloaded health system fails patients in need of non-COVID-related treatment.
Research by the Organization for Economic Co-operation and Development (OECD) notes how early data points to delays in accessing primary care facilities, surgeries or outpatient departments for chronic conditions.
The question remains as to whether the national health system responded in a timely and adequate manner to the needs of patients with other diseases
Even if we shift the focus of our analysis solely to the 4 week-period (46th – 49th) when unexpected mortality peaked, the percentage of confirmed deaths associated with COVID-19 corresponds to only 68% of statistically unexpected deaths. Notably, excess deaths amounted to 3,226, while COVID-related deaths were 2,219. This suggests that 1002 deaths, or 32% of unexpected deaths, may have been indirectly related to the pandemic.
On October 6, before the sharp increase in deaths, K. Majorkinis had referred to excess mortality rate upon answering journalist Natassa Spagadorou’s question regarding possible postponement of surgeries due to the coronavirus: “…we epidemiologists observe, measure, and quantify the pressure on the healthcare system based on the so-called excess mortality, i.e. when we see more deathsthan expected. There is a European database called EUROMOMO, where we determine how much the mortality threshold has been exceeded, that is, how much strain has been put on the general health of the population, which is also dependent on the health system. And Greece has recorded no excess mortality during the pandemic. Not in the first wave and not now. We must stress this because it is highly important. You mentioned surgeries having been postponed. Maybe that’s true for minor surgeries but it’s not something that would cause the patients… What I mean is that, if many serious surgeries had indeed been postponed, this would have been evident from the data.”
Indeed, Greece has recorded a lower level of excess mortality compared to other countries, and the number of deaths did not exceed the threshold for expected mortality during the first wave of the pandemic. However, the question remains as to whether the national health system responded in a timely and adequate manner to the needs of patients with other diseases throughout 2020 and as to which are the areas with the highest rate of statistically unexpected deaths regardless of cause.
Given that it will be some time before the Hellenic Statistical Authority publish detailed data on causes of death for 2020 (the report on causes of death for 2018 is due to be published in February 2021), it is important that authorities not only take into account excess mortality rate upon taking measures, but also that complete transparency in COVID-19 data is ensured, so as to assess the overall health care quality provided to patients during the pandemic and to investigate mortality from treatable diseases.
Burning in the cold: Greece battles with fires all year long
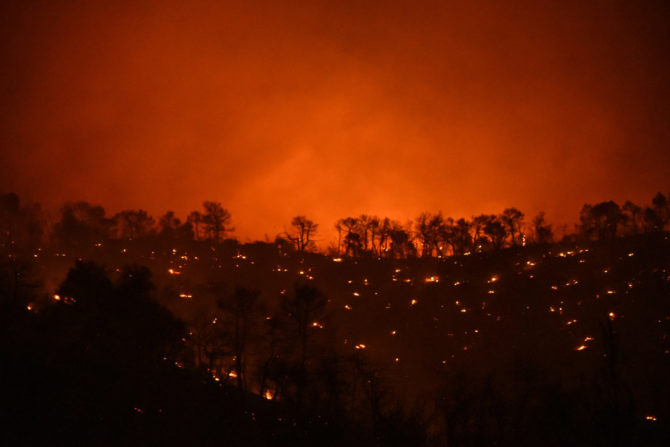
In March 2019, Greece recorded the highest number of out of fire season fires since 2000
2020 sees dramatic rise in deaths in Central Macedonia and lower fatality rate in Central Greece
According to weekly death statistics provided by ELSTAT, in 2020 (1st – 49th week), a 10.5% increase of deaths regardless of cause was recorded in Central Macedonia compared to 2019, as well as a 12.1% increase in Eastern Macedonia and Thrace, two of the regions that were heavily affected by the coronavirus pandemic. We do not know, however, the true extent of the virus in these areas. This can be either due to a lack of data on the number of tests performed in each area (which would otherwise help us estimate the actual number of infections), or because information on the geographical distribution of deaths is not disclosed. One year after the coronavirus outbreak and despite iMEdD Lab’s repeated requests for detailed data on confirmed deaths by regional unit or region, EODY, unlike the rest of the world’s competent authorities, refuse to publish this information.
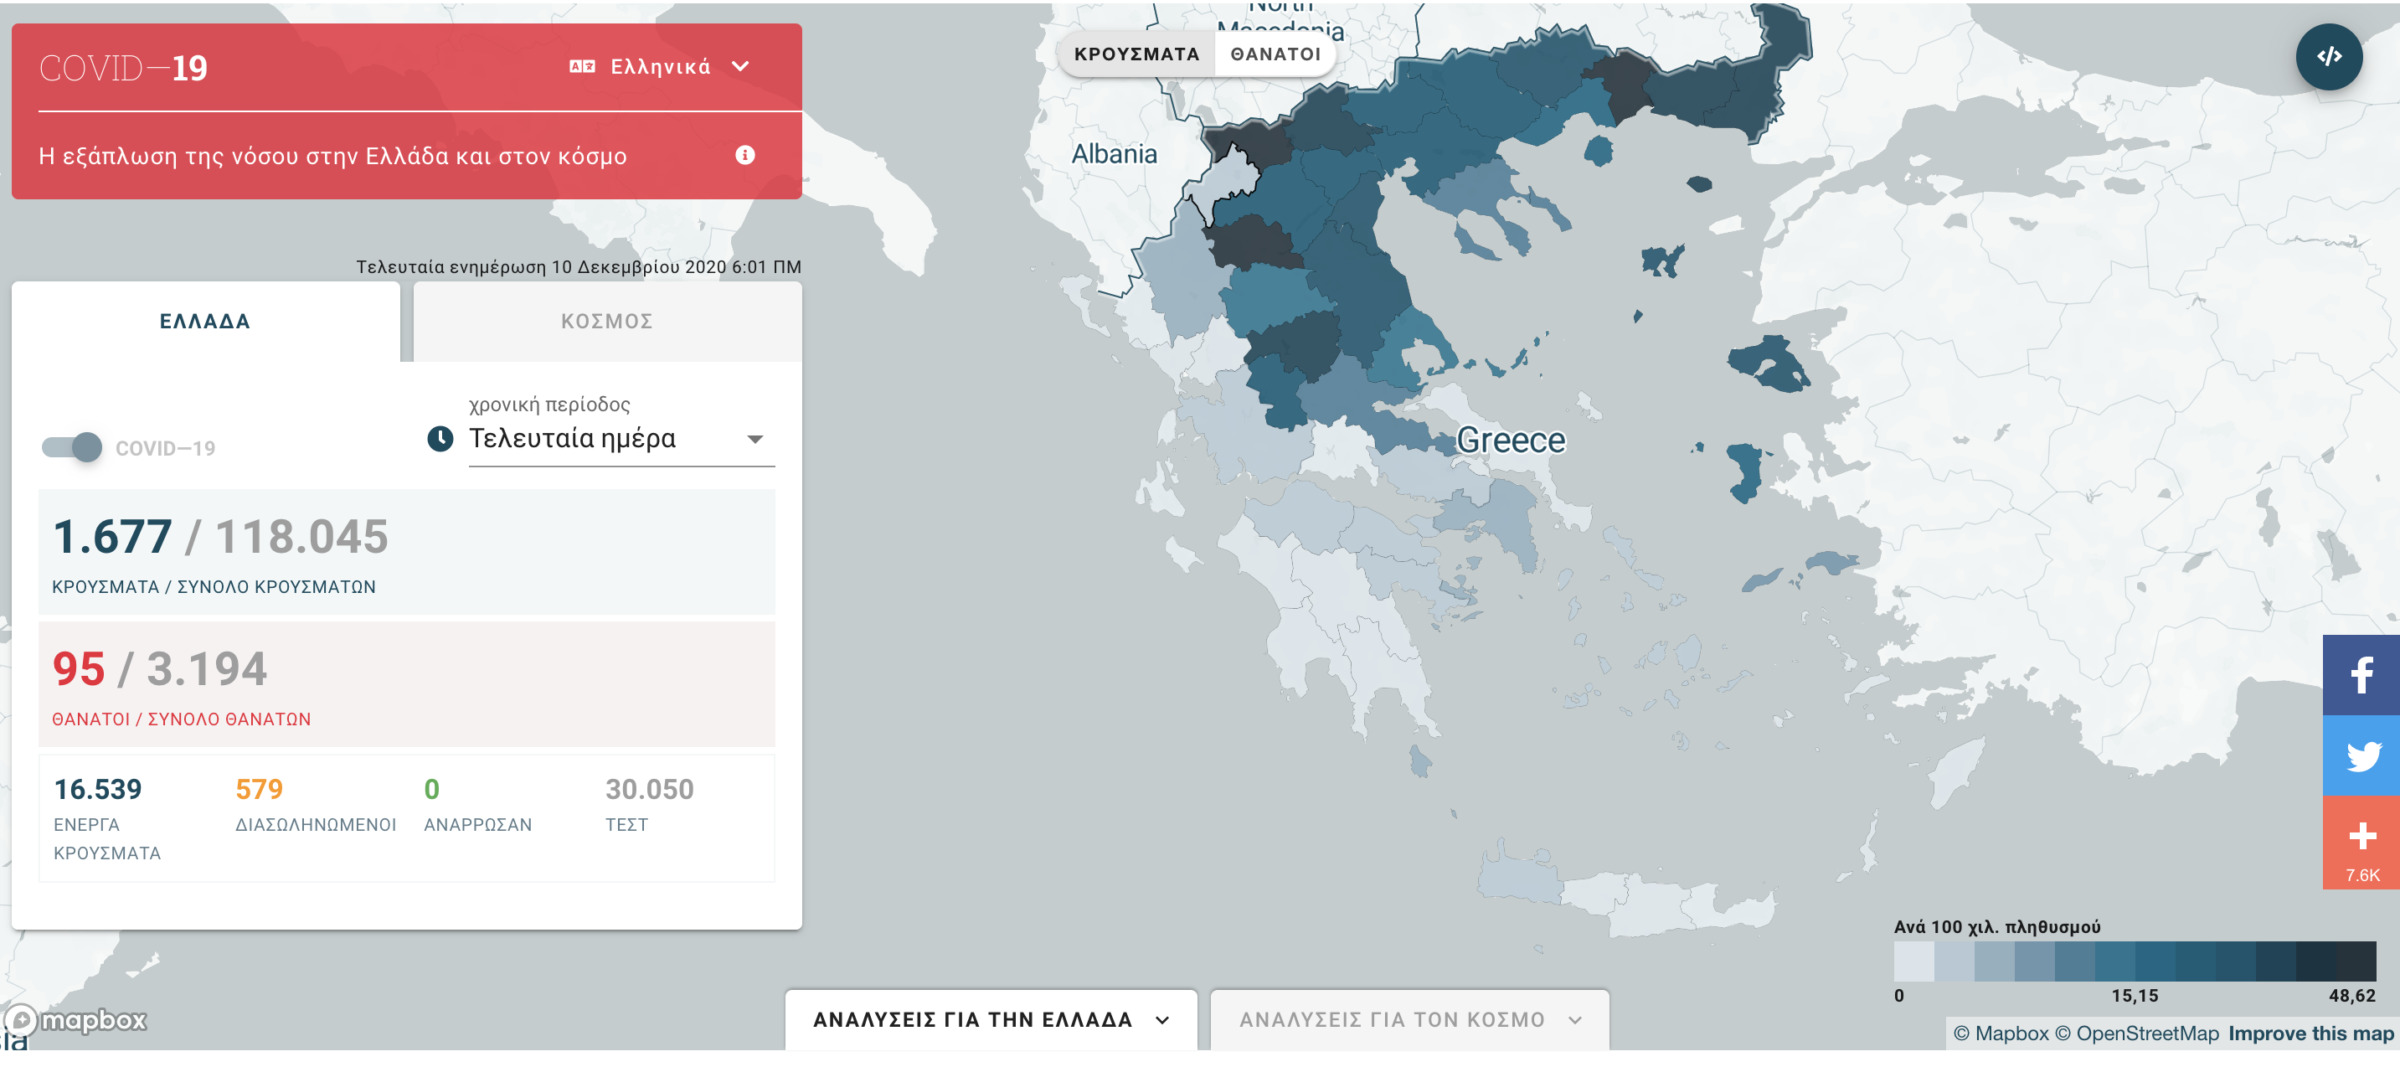
Drama regional unit sees eight times more deaths than Athens, in proportion to its population
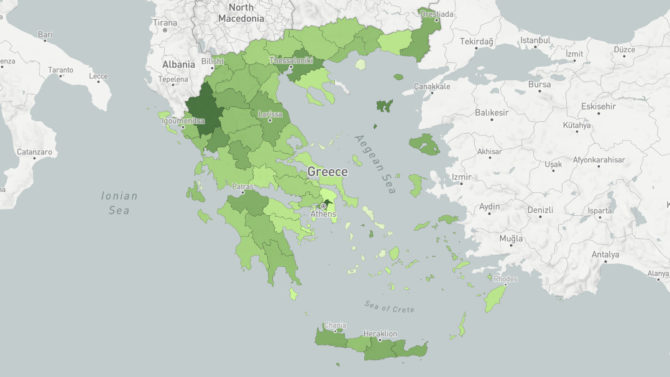
On December 15, iMEdD Lab published data on the geographical distribution of 3,214 deaths per Regional Unit that had been collected since the pandemic onset (reference date: December 10). According to this data, Pella, Drama, Pieria and Serres recorded the highest death toll in Greece, in proportion to their population.
Continuing its research on the impact of the coronavirus pandemic on the country, iMEdD Lab now publishes data that has been amassed since the onset of the pandemic (reference date: 18 January 2021) regarding the geographical distribution of a sample of 5,471 deaths.
The areas with the highest number of deaths per 100,000 population (a correlation that allows us to compare areas with different population sizes) are:
- Drama (231.1 deaths per 100k: 60% increase compared to December 10)
- Pella (218.2: 43.27% increase)
- Pieria (177.8: 54.61% increase)
- Kilkis (177.8 74.39% increase)
Between December 10 and January 18, deaths per 100k population more than doubled in the Regional Units of Karditsa (134.09%), Rodopi (114.81%), Evros (108.57%), Kozani (103.70%) and Xanthi (103.28%). With 120.5 deaths per 100k population, Thessaloniki recorded a 76.86% increase in deaths, while Attica (including the regional units of Athens, Piraeus and Islands) recorded 28.4 deaths per 100k, seeing a 59.31% increase.
Geographical distribution of reported COVID-19 deaths
More than eight out of ten deaths have been among people 65 and older
The overall fatality rate from COVID-19 in the country is estimated at 3.7%. The fatality rate is the proportion of people who die from a specified disease among all individuals diagnosed with the disease. Although it is a very important indicator, caution is advised in its interpretation. This is because the number of people diagnosed with COVID-19 does not correspond to the actual population that has contracted the virus. The reason is twofold; first of all, not the entire population is tested and, secondly, because people who do get tested have usually already had symptoms. This is why fatality rate may be overestimated compared to the actual risk of death from COVID-19.
Examining data by age group we can see that the greatest risk of dying from COVID-19 is among those aged 65 or older. Notably, 17.1% of total confirmed cases (February 1, 2021) belong to this age group, with 84.5% of these people having succumbed. The fatality rate, therefore, is estimated at 18.8%.
Drama, Pella, and Pieria count record of deaths among people 65 and older
Βάσει των στοιχείων θανάτων που δημοσιεύουμε σήμερα και της εκτίμησης του πληθυσμού για το 2019 από την ΕΛΣΤΑΤ ανά ηλικιακή ομάδα, προσπαθήσαμε να βρούμε σε ποιες περιοχές καταγράφονται οι περισσότεροι θάνατοι ανθρώπων μεγαλύτερης ηλικίας καθώς και εάν υπάρχουν διακυμάνσεις στη θνησιμότητα και τη θνητότητα ανά περιφερειακή ενότητα.
To answer these questions, we used EODY’s official report regarding the reference date under investigation (January 18) as a point of reference. According to the report, 17% of total cases and 84.5% of total deaths are among people 65 and older. We subsequently made the assumption that these percentages apply equally to all regional units of the country and, based on that, we found that, in Pella, Drama and Attica, 85 out of 100 deaths are among people 65 or older. Finally, we extrapolated elderly deaths to population ages 65 and above by regional unit.
Mortality among people 65 and older
In absolute numbers, Thessaloniki is estimated to have had the highest number of deaths among the elderly (1123), followed by Athens (896) and, by a large margin, Pella (251). Given that Thessaloniki and Athens have recorded the highest number of coronavirus deaths, these figures are to be expected. But when we include the elderly population and calculate the rate per 100,000 population, the ranking of Regional Units changes.
More specifically, Drama finds itself at the top of the list, with 757.1 deaths among older adults aged 65 and over per 100,000 population, followed by Pella (743.3), Pieria (650.6), Kilkis (594.5) and Xanthi (530.3). Thessaloniki ranks 7th and Attica comes in 22nd.
Πώς να χρησιμοποιήσετε την εφαρμογή για την COVID 19
Πώς να χρησιμοποιήσετε την εφαρμογή και να ενσωματώσετε τα γραφήματα και τους χάρτες σε δικές σας σελίδες.
After a similar analysis of COVID-19 cases among the elderly, Thessaloniki is found to have recorded the highest number of cases (2,335) among people aged 65 and older per 100,000 population of the same age group, followed by Xanthi (2228.4), Pella (2147.7), Drama (2027.6) and Pieria (1916.1). This indicator helps us identify areas of the country that are estimated to record the highest transmission rates among this age group. Similarly, upon calculating the risk of dying from COVID-19 among the elderly population (case fatality risk), Drama, Pella, Grevena, Pieria, Serres, Kavala, Kilkis and Imathia are found to have the highest rates, far exceeding the average fatality rate of COVID-19 infections in this population group. In any case, it should be noted that because we only detect COVID cases when someone tests positive and we don’t know the actual number of cases, and because there is a lack of information on the number of tests performed per regional unit, this analysis should be read with extreme caution – even if it does point to a trend – as it may be an overestimate of the situation.
Estimating case fatality rates of COVID-19
From December 10 to January 18, based on the samples we published by regional unit, the majority of new COVID-19 deaths occur in Drama, which records 281 new deaths among the elderly per 100,000 population aged 65 years and over (60% increase in deaths among the general population). It is followed by Xanthi (267.88 deaths -103.28% increase in deaths among the general population), Kilkis (251 deaths – 74.39% increase), Pieria (227.3 deaths – 54.6% increase), Pella (221.4 deaths – 43.2% increase), Thessaloniki (212.8 deaths – 76.8% increase), and Florina (165.8 deaths – 70.97% increase in deaths among the general population).
During this period, Drama, Kilkis and Karditsa report the highest fatality rate (the ratio between new confirmed deaths and confirmed cases).To calculate the fatality rate, we included confirmed cases recorded 20 days before December 10, and came up with an average time from infection to death in patients, based on studies and data on the incubation period. The last date considered for the calculation of new cases is January 8th.
Epidemiological data from the COVID-19 outbreak is the only weapon in scientists’ and states’ arsenal against this virus, about which nothing was known up until 12 months ago. At the same time, public disclosure of this information is necessary – especially now that conspiracy theories run rampant – in order for citizens to be able to make informed decisions about their lives at such a critical time in history by having taken into account all the parameters associated with this pandemic, but also in order for each one of us to assume personal responsibility on the basis of clear and unbiased facts.
After having analysed all available data related to COVID-19 in Greece, serious questions of public interest arise regarding the real impact of the pandemic on the country – and these questions cannot be answered by EODY’s “piecemeal” updates.
In particular, it is vital that we have access to the following information (per day and regional unit):
• Number of in and out-of-hospital deaths
• Number of deaths inside and outside the ICU
• Number of deaths per hospital
• Number of beds available in hospitals and ICUs
• Hospital bed and ICU occupancy
• Number of doctors and nurses assigned to the COVID-19 response
• Number of people tested and number of people who tested positive (not the number of samples taken)
• Number of inpatients, intubated patients, intubations, and discharges per hospital
• Average age of death and confirmed cases
• Active cases
• Detailed epidemiological data on activities proven to be related to the transmission of the virus
If we’d had access to this data, we would have had a clearer picture as to what went wrong during the second wave of the pandemic and why Central Macedonia and Eastern Macedonia, and Thrace reported higher fatality rates compared to the rest of the country; we would have been able to estimate the actual pandemic death toll and, most importantly, we would have been better prepared for the third wave.

